The quota attainment number in most board decks is calculated differently than the one in the CRM. I’ve seen this play out hundreds of times. The board deck shows team attainment as a blended average across all quota-carrying reps.
The CRM shows 38 reps, of whom 14 hit their number. Same company, same quarter, two different stories. The board sees 91% team attainment. The CRO knows that more than half the team missed.
Average quota attainment across SaaS was 42.69% in Q2 2025. That figure comes from RepVue’s Q2 2025 Cloud Sales Index, which analyzed performance across 246 cloud and software companies and approximately 47,000 quota-carrying sales professionals.
Average attainment across those reps: 42.69%. That is the number your capacity plan should start with, not the blended team average that lands in the board deck.
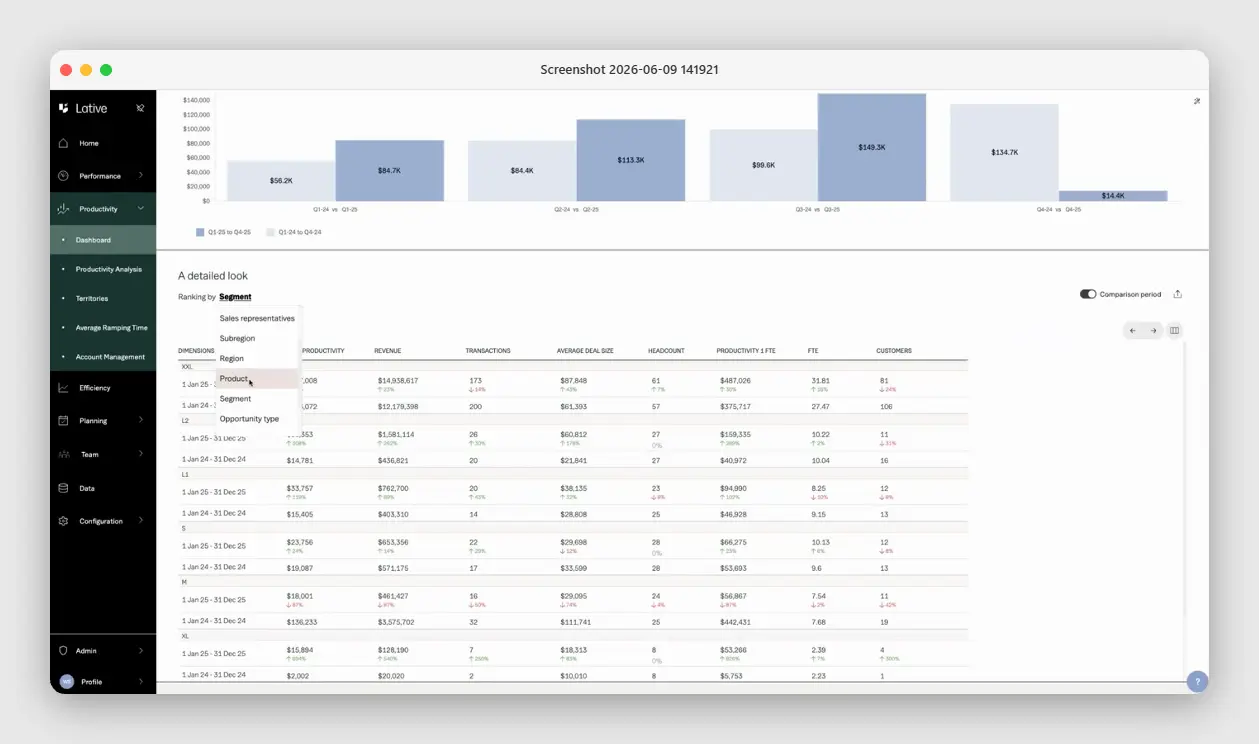
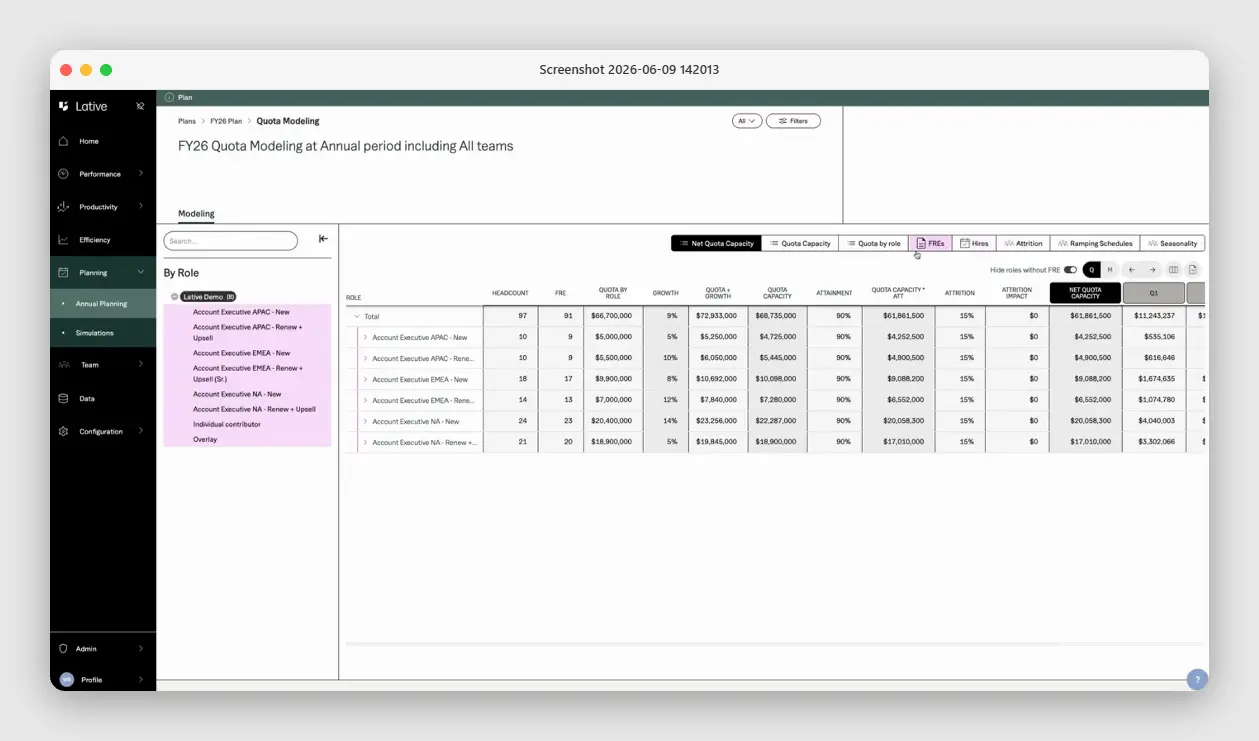
Lative’s Sales Capacity Planning module tracks quota attainment at rep, segment, and portfolio level from the same data source your CRO uses. What follows is the benchmark context you need to interpret those numbers correctly.
Attainment rate vs. quota participation: the two numbers people confuse
Most benchmark arguments fall apart because two different metrics both get called “quota attainment.” Average attainment rate is the percentage of quota the average rep closed, a 43% figure means the average rep hit 43% of their number. Quota participation is the percentage of reps who hit 100% or more, a 60% figure means six in ten reps cleared their quota.
You will see both quoted as “attainment,” and they tell you opposite things. A team can run 75% participation against a 60% average attainment rate, because the reps who miss tend to miss big while the reps who beat only beat by a little. When someone hands you a benchmark, the first question is which of the two they are measuring. The rest of this post is explicit about which number it means each time.
Overall quota attainment rates in 2025–2026
The traditional expectation was that 50–60% of fully ramped reps would hit quota in a given period. OpenView Partners’ 2023 analysis by Kyle Poyar described this as the standard SaaS participation rate that quota design should be built around. That benchmark no longer holds for most companies.
The Hyperbound 2025 B2B Sales Performance Benchmark Report, aggregating data from Ebsta x Pavilion, Salesforce, and Winning by Design, puts the picture plainly: only 28% of reps met quota in 2023, down from 44% in 2022.
By late 2024, average attainment had recovered slightly to approximately 43%, but quota participation, the share of reps actually hitting their number, remained well below the historical 50–60% benchmark.
Look at those two numbers together. Average attainment of 43% means that even the reps who are hitting quota are, in aggregate, hitting it at a rate that drags the team average below half of target. The capacity implications are significant: if your plan assumed 55% quota participation and actual participation runs at 38%, your productive capacity is not what your headcount count suggests.
Attainment by company stage
Stage matters more than most CROs admit when reading benchmark data. A 42% average attainment figure drawn from 47,000 reps across 246 companies blends together pre-product-market-fit startups, Series B companies in active GTM build mode, and mature enterprises with stable territories. Those are three different problems.
The pattern I’ve observed: attainment tends to be most volatile between Series A and Series B, when companies are scaling a sales motion that has not fully stabilized.
Territory design is still evolving. Ramp curves have not been validated against real data. Quotas are often set from top-down targets rather than bottoms-up capacity math.
By the time a company reaches Series C, the distribution of attainment across reps usually becomes more predictable, but the companies that get there cleanly are the ones that built the capacity model correctly in the earlier stages.
The High Alpha 2025 SaaS Benchmarks Report, drawing on 800+ survey respondents, found that companies with AI deeply incorporated into their products outperform peers across all ARR bands, with the performance gap most significant at the $1–5M ARR cohort.
The implication for quota attainment: stage-specific benchmarks require stage-specific data. Using a cross-stage average as your planning input introduces a systematic error.
Attainment by rep tenure
The most underused segmentation in quota attainment analysis is tenure. Ramping reps and fully productive reps carry the same quota line in most capacity models, but they do not carry the same productive capacity. A rep in month two of a six-month ramp is not a 33% rep. They are a zero-revenue rep in terms of contribution to the current quarter’s number.
A company hiring 12 reps in Q1, modeling a six-month ramp, and carrying them at 50% productive capacity in Q2 will build a plan that shows $2.4M in productive capacity from those reps. The real number is closer to $600K, because the ramp curve is not linear and the first two months produce close to nothing in closed revenue.
The attainment benchmarks reported at the aggregate level mask this. When you see “43% average attainment,” a material portion of the reps in that denominator are still ramping.
Strip them out and measure fully ramped rep attainment separately. That number, the one that tells you how your established reps perform against their targets, is the only number that gives you a stable planning input. One more thing the aggregate hides: attainment rarely distributes evenly. It is usually positively skewed, a handful of reps well above 100% pulling the average up while the median rep sits below it. Plan against the median and the distribution, not the mean.
What separates top-quartile teams
The Ebsta x Pavilion 2024 analysis of 4.2 million opportunities found that teams adopting RevOps-driven strategy achieved 87% higher win rates and 21% shorter sales cycles than peers.
That is the largest performance gap in the benchmark data. The mechanism matters: capacity modeling and quota architecture drove the performance gap, not seller quality. Teams with RevOps-driven systems know what capacity actually is before they build quotas from it.
Territory design
Top-quartile teams design territories around market potential and historical conversion rates, not around headcount ratios. A rep assigned a territory where the total addressable market supports $800K in annual bookings cannot hit a $1.2M quota regardless of activity level. Quota design that ignores territory potential creates a structural miss before the quarter starts.
Ramp time
The best-performing teams validate ramp curves against trailing actuals by hire cohort and segment. They do not use industry averages. A six-month industry benchmark for ramp time applied to an enterprise segment with nine-month sales cycles will produce a capacity plan that overstates productive capacity for the first year of a hiring wave.
Quota-setting methodology
Top-quartile teams build quotas from bottoms-up capacity math first, then test it against the board’s top-down target. The gap between those two numbers is a fact-based conversation, not a negotiation. The teams that miss quota most consistently are the ones that start with the target and work backward to build a plan that appears to justify it.
How to improve quota attainment
Because attainment is an output, you do not raise it by pushing reps harder against the same broken inputs. You raise it by fixing the inputs that produced the shortfall:
- Right-size the quota to capacity. If attainment sits below 50%, the quota is almost certainly set above what the team can produce. Rebuild it bottoms-up from trailing attainment and ramp, not down from the investor target.
- Fix the ramp curve, not the rep. If ramping cohorts are dragging the average, the ramp assumption is wrong. Faster onboarding and cleaner territory hand-off move attainment more than coaching tenured reps who are already at quota.
- Segment territories by real potential. A rep in a territory that only supports $800K cannot hit a $1.2M quota. Attainment problems are often territory-design problems wearing a performance-management costume.
- Close the coverage gap early. Attainment that craters in the back half usually traces to a pipeline coverage gap that was visible months earlier. Catch it in the planning cycle, not the QBR.
How to use this data
Before using any benchmark, calibrate it to your segment and deal size. A 43% average attainment figure drawn from a pool that includes SMB reps with 30-day sales cycles tells you nothing useful about attainment in your enterprise segment with 180-day cycles. The benchmark is a starting point for a conversation, not a planning input.
The questions that matter for your capacity plan:
- Fully ramped attainment rate: what share of reps past ramp are hitting quota, by segment
- Productive capacity per rep: average quota attainment for ramped reps multiplied by their quota, not the quota itself
- Ramp curve by hire cohort: how long it actually takes for reps in your segment to reach full productivity, measured in closed ARR not activity metrics
- Quota participation rate: the percentage of reps at or above 100% of quota, segmented by tenure and territory
These are the numbers Lative surfaces in the Sales Capacity Planning module, at rep, segment, and portfolio level, on trailing actuals, updated continuously rather than once per planning cycle.
For the demand engine math that feeds these capacity inputs, see Mastering the Demand Engine: CMO Pipeline Math. When attainment benchmarks show that the median SaaS company runs at 43%, the question is where you sit relative to your own historical baseline. That comparison requires your data, not an industry average.
Lative tracks quota attainment at every level, rep, segment, portfolio, in real time. See how it changes the capacity planning conversation.
Werner Schmidt is the CEO and Co-founder of Lative, with over 20 years of experience in Revenue Operations with companies including Forcepoint, Aruba Networks, Citrix, and Sage.