Your capacity model said the new cohort would hit 60% of quota in month 3. One rep hit 80%. Two hit 40%. The model’s aggregate looked fine, until you recalculated the Q2 coverage number and found a $340K gap that appeared out of nowhere.
The rep who hit 80% did not save you. The two at 40% created a hole the model did not see because it was averaging productivity across a cohort that was never uniform to begin with.
Gong’s 2025 GTM onboarding research found that the path to full productivity in new hires is “measurable and repeatable,” but only when the organization tracks what activities new reps are performing, not just whether they hit the aggregate quota attainment line at the end of month 6.
The gap between a productive ramp and a stalled one shows up in specific behaviors in the first 30 days, not in the summary number at 90 days.
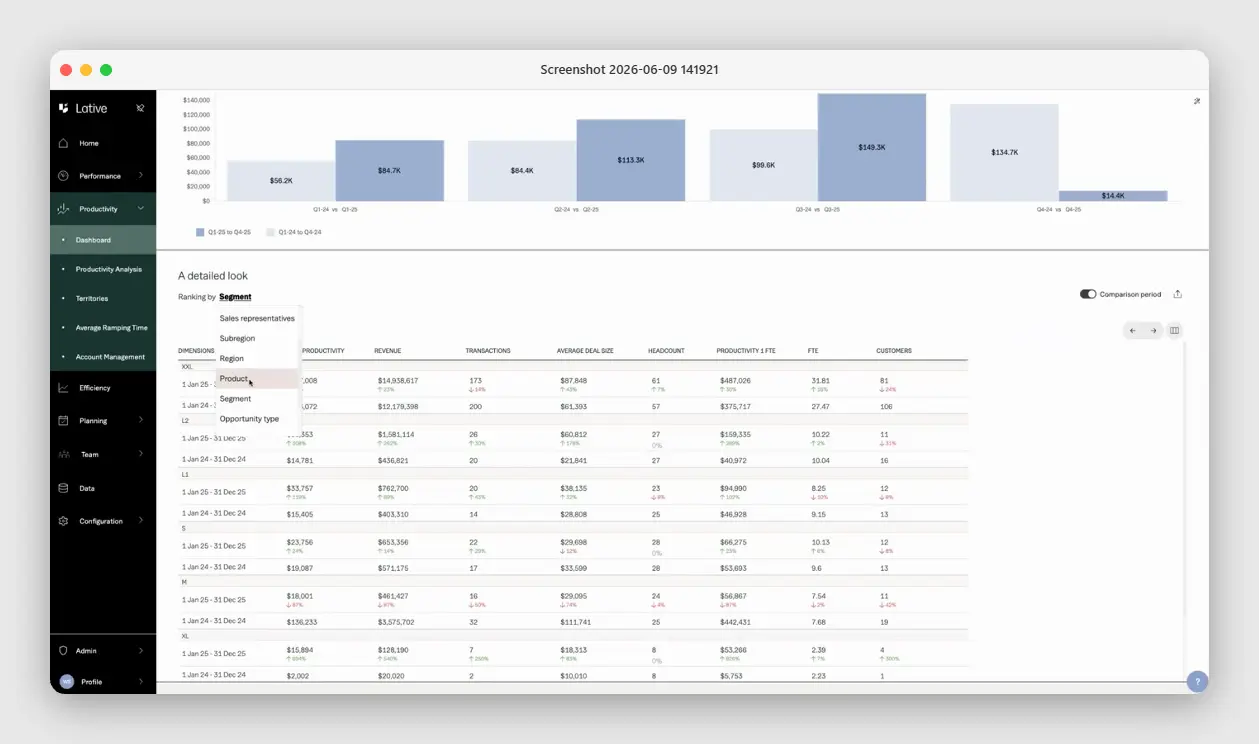
Lative’s Sales Capacity Planning module tracks rep productivity attainment by cohort and tenure band, so when one cohort starts diverging from the ramp assumption, your capacity model updates in real time rather than surfacing a coverage gap in the next quarterly review. When you model sales ramp time as a living variable rather than a static assumption, your capacity plan runs on the real number, not an annual estimate that was stale by Q2.
What sales ramp time actually measures vs. what most teams track
Most teams define ramp time as the number of months from a rep’s hire date to first closed deal. That is the wrong measurement. First deal closed is a lagging indicator and a noisy one, it depends heavily on deal size, territory maturity, and luck on timing.
What ramp time should measure is the number of months from hire date to a rep producing at a defined percentage of their full quota on a sustained basis. Those are not the same thing, and conflating them is why ramp assumptions go stale.
What most teams track
- Months from hire to first closed deal
- A snapshot attainment number at a fixed milestone
- A blended cohort average that hides divergence
What ramp time should measure
- Months to sustained production at 80%+ of full quota
- A productivity curve: accelerating, plateauing, or declining
- Cohort and individual tracked separately, both kept in view
Time to first deal vs. time to full quota
Time to first deal is a milestone. It tells you a rep can close. Time to full quota is a productivity curve. It tells you when the rep is generating the productive capacity your model assumed when you made the hire decision.
A rep who closes a $10K deal in month 2 and then closes nothing until month 7 did not ramp in month 2. They closed one deal and then stalled. The ramp that matters for capacity planning is when they are reliably producing at 80% or more of full quota across consecutive months.
That number is typically 6 to 12 months from hire depending on segment, and it varies by more than most capacity models account for.
Productivity curve vs. snapshot attainment
A snapshot attainment number at month 6, “rep is at 62% of quota,” tells you where they landed. A productivity curve tells you whether that number is accelerating, plateauing, or declining.
Two reps at 62% in month 6 are not the same. One went 20%, 35%, 50%, 62% over four months. The other went 70%, 60%, 65%, 62%. The first rep is on a growth curve. The second is flattening out two quarters before they should be fully productive. A capacity model that only checks attainment at fixed milestones misses the second rep’s problem until it is too late to intervene.
Cohort vs. individual tracking
Cohort tracking and individual tracking serve different purposes. Cohort tracking tells you whether your ramp model is calibrated correctly for the current GTM environment, whether the assumptions you made in planning are holding across a class of reps hired at the same time.
Individual tracking tells you where specific reps need intervention. The capacity model depends on cohort tracking. Individual performance management depends on individual tracking. Mixing them produces an average that obscures both signals. You need both, and they need to stay separate.
How to calculate sales ramp time
There are three common ways to put a number on ramp time, and they are not interchangeable:
- Time to first deal: months from hire date to first closed-won. Easy to measure, but noisy, and the least useful for planning. It tells you a rep can close, not that they are productive.
- Time to full productivity: months from hire date to the rep sustaining a defined percentage of full quota, usually 80% or more, across consecutive months. This is the number your capacity model actually needs.
- Sales-cycle method: take the average sales cycle for the segment and add a buffer for prospecting and onboarding. A useful first estimate before you have cohort data, an enterprise segment with a nine-month cycle will not produce full-quota reps in six months no matter what the onboarding deck promises.
Whichever you use, calculate it by cohort and segment, not as a single company-wide average. The blended average hides the exact divergence that breaks the capacity plan, and it is the number most teams quietly carry forward year after year.
Ramp benchmarks by segment
The benchmarks matter less than your own historical data. And the direction of travel is worth naming: across B2B SaaS, ramp has been getting longer over the last five years, not shorter, as products get more complex and onboarding gets leaner. If you have not yet built your own cohort history, benchmarks give you a starting assumption to stress-test. Here is what the data shows by segment, using figures I have seen corroborated across multiple SaaS companies in each band.
SMB reps
SMB reps typically reach 80% of quota within 3 to 4 months of hire. Shorter sales cycles ($5K to $15K ACV range, cycles under 45 days) mean more at-bats per month, and reps learn faster by volume.
The productivity curve accelerates quickly if the territory is warm and the ICP is tightly defined. Where SMB ramp goes wrong: territories that are too large to cover, ICP definitions that are too loose, and outbound motion that is not yet proven.
A rep who is handed a defined territory with a clear motion can ramp in 90 days. A rep asked to figure out the motion while building pipeline from scratch takes 5 to 6 months.
Mid-market reps
Mid-market reps typically reach 80% of quota in 5 to 7 months. Sales cycles in the $15K to $60K ACV range run 60 to 120 days, which means a rep hired in January often does not close their first meaningful deal until April or May.
The ramp assumption in most capacity models for mid-market is 6 months to full productivity. The actual range I see in practice is 5 to 9 months, with the outliers driven by territory quality and manager-to-rep ratio. Mid-market ramp is where capacity planning errors are most expensive: if you assume 6 months and it takes 8, the coverage gap shows up exactly when the company needs the number.
Enterprise reps
Enterprise reps are a different model entirely. A sales cycle of 6 to 18 months means a rep hired in January may not close their first deal until Q3 or Q4 of the following year.
Full quota attainment for a true enterprise rep, $150K to $300K+ ACV, multi-stakeholder deals, realistically takes 9 to 12 months from hire.
Some organizations use an 18-month ramp assumption for enterprise. The capacity planning implication: an enterprise rep hired today is not generating productive capacity this fiscal year. Every enterprise headcount decision is a multi-year investment decision, and the capacity model has to treat it that way.
The four levers that shorten ramp time
I was part of the problem at early-stage companies where we hired fast and then wondered why ramp time was creeping up. There are four levers that reliably compress the ramp curve when pulled correctly. None of them is “better training.”
- Territory design: Quality of accounts and coverage ratio handed to the rep at hire
- ICP clarity: Whether reps know exactly who to target before they make their first call
- Manager-to-rep ratio: Coaching frequency and feedback loops in the first 90 days
- Onboarding data access: Territory-specific pipeline data from day one, not generic CRM training
Territory design
Territory quality is the single largest variable in ramp time that sales leadership controls. A rep handed a territory with 200 qualified accounts, a defined coverage ratio, and a clear outbound motion will ramp faster than an equally skilled rep given a territory that was carved out of whatever was left after senior reps took theirs.
Territory design happens before the hire decision. If you are designing territories during onboarding, you are already behind.
ICP clarity
A rep who understands exactly which accounts to prioritize and why closes faster than a rep prospecting broadly. ICP clarity means the rep can look at a list of 50 accounts and rank them by likelihood to close within the quarter, not because they worked for 3 years in the industry, but because the ICP definition is tight enough that the prioritization is almost mechanical.
When ICP is vague, new reps spend their first 60 days learning it by trial and error. That is ramp time you cannot recover.
Manager-to-rep ratio
The manager-to-rep ratio during ramp has a direct effect on time to productivity. A manager carrying 8 new reps simultaneously cannot give any one of them the deal coaching they need in months 2 through 4.
The industry standard is 1:6 to 1:8 for experienced reps. For ramp-stage reps, 1:4 to 1:5 is closer to what actually produces faster productivity curves.
This is a capacity planning input, not just an HR decision. If your headcount plan includes hiring 12 mid-market reps in Q1 but your manager capacity only supports effective coaching for 8 at ramp stage, you have a capacity problem that does not show up in headcount count.
Onboarding data access
New reps ramp faster when they have visibility into the data that tells them what good looks like: which account types closed fastest in the last 12 months, which deal stages have the highest drop-off rates, which conversation patterns correlate with closed-won.
The goal is territory-relevant data access from day one, not more dashboards. When reps learn from your company’s actual motion, not generic sales training, the learning compounds instead of stalling.
Gong’s onboarding research (2025) found that reps who use real account data in their training from the first week show materially higher early-stage productivity than reps trained on synthetic or anonymized scenarios.
How Lative tracks ramp in the capacity model
Most capacity models use a static ramp assumption: 6 months to full productivity, applied uniformly across all new hires regardless of segment, territory, or hiring cohort.
That assumption was calibrated at some point in the past and has not been updated since. When your GTM motion changes, new ICP, new territory structure, new product line, the static assumption becomes wrong, and you do not know it is wrong until coverage starts missing.
Lative’s Sales Capacity Planning module has a dedicated Average Ramping Time view that measures days to full or average productivity, time to first deal, and the ramp of every individual rep alongside the cohort. It tracks ramp cohorts by hire date, segment, and tenure band.
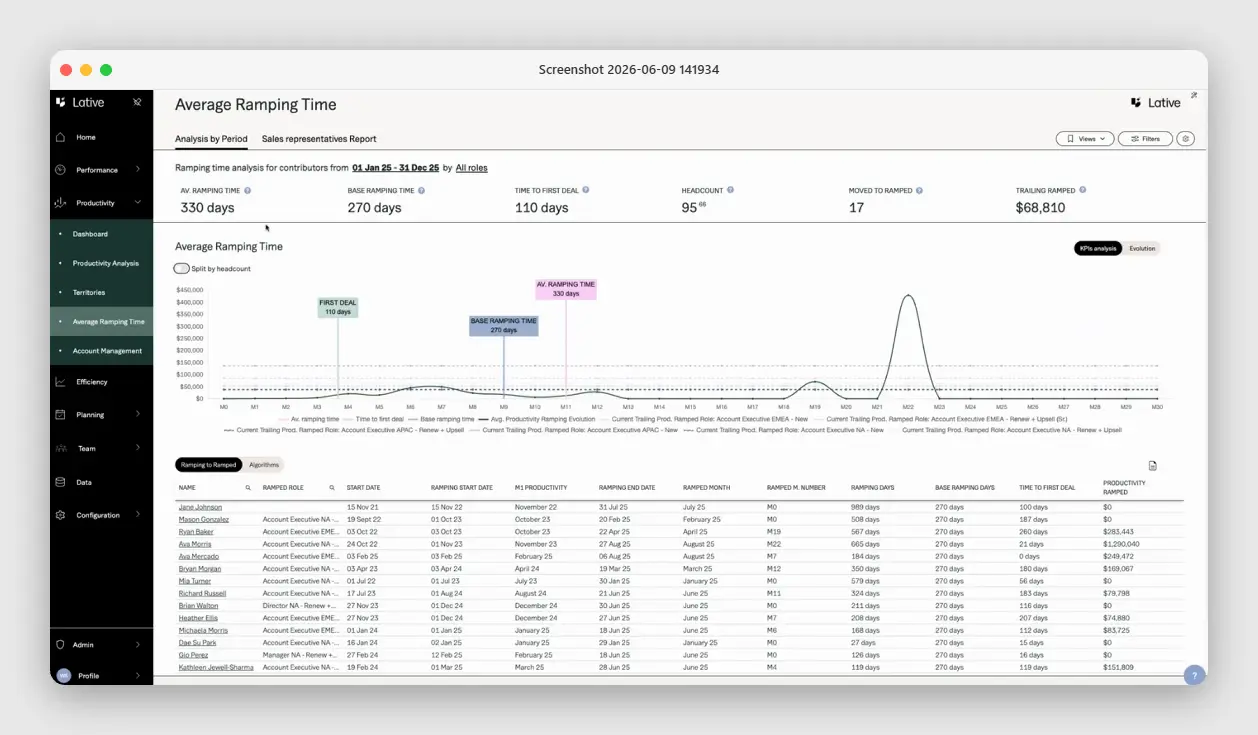
Every month, the actual productivity attainment of each cohort updates the ramp curve in the capacity model. If your January mid-market cohort is running 2 months behind the ramp assumption, the model surfaces the coverage impact immediately, in the current quarter, while you still have options, not in the QBR where the miss is already locked in.
For more on how revenue operations connects to capacity planning foundations, see what is revenue operations.
Key takeaways
- Ramp time should measure months to sustained full-quota production, not time to first deal.
- Track ramp by cohort and segment; a blended average hides the divergence that breaks the plan.
- Benchmarks: SMB 3–4 months, mid-market 5–7, enterprise 9–12 — but your own cohort data beats any benchmark.
- Four levers compress ramp: territory quality, ICP clarity, manager ratio, and day-one data access.
Frequently asked
What is a good sales ramp time?
It varies by segment: SMB reps typically reach 80% of quota in 3–4 months, mid-market in 5–7 months, and enterprise in 9–12 months. Measure against your own cohort history, not a borrowed benchmark.
How do you calculate sales ramp time?
Measure months from hire to a rep sustaining a defined percentage of full quota (usually 80%+) across consecutive months, by cohort and segment. Time to first deal is a noisy milestone, not a ramp number.
Why is sales ramp time getting longer?
Products are more complex and onboarding is leaner. Across B2B SaaS, ramp has trended longer over the last five years, which is why static ramp assumptions go stale and break capacity plans.
What shortens sales ramp time?
Four levers: territory quality, ICP clarity, manager-to-rep ratio during ramp, and territory-relevant data access from day one. Better training is not on the list.
Why does ramp time matter for capacity planning?
A ramping rep produces a fraction of full quota for months, so headcount and capacity are different numbers. Modeling ramp as a live variable keeps the capacity plan on the real number instead of an annual estimate.
If your ramp assumptions have not changed in four quarters, they are wrong by now. See how Lative tracks rep productivity attainment by cohort so your capacity model stays current. Request a demo.
Werner Schmidt is the CEO and Co-founder of Lative, with over 20 years of experience in Revenue Operations with companies including Forcepoint, Aruba Networks, Citrix, and Sage.