Pipeline math
There are two versions of your job as CMO. The first faces outward: brand, campaigns, messaging, creative. The second also faces inward: you are your organization’s deepest expert on how your demand engine converts marketing investment into revenue. That version gets the budget.
I’ve watched this play out hundreds of times over 20 years in RevOps. The CMOs who hold their budgets and grow them share one thing: they can answer the pipeline math question with numbers, by segment, not with a narrative. The ones who get cut in the next budget cycle cannot.
The CMOs who hold their budgets and grow them share one thing: they can show the math behind their numbers.
HubSpot’s 2026 State of Marketing found that 73% of marketing teams now face more budget scrutiny than in previous years. Spencer Stuart found that more than two-thirds of CMOs now face direct CEO and CFO pressure to deliver measurable cost savings from their programs within two years. The pressure is hardest to meet without a precise answer to the pipeline math question.
The demand engine as a conversion chain with four knobs
An April 2025 analysis of 1.8 million deals found that 81% of revenue leaders say deals are more complex today than three years ago. More stakeholders in each buying committee, longer approval cycles, and higher scrutiny on every line item mean that conversion rates at each funnel stage have more variables to account for than they did even a year ago.
A pipeline math model that ignores that complexity, or averages across all segments, will systematically underestimate how much pipeline marketing needs to generate.
The demand engine is a series of compounding conversion rates. Each rate is specific to your business, your segment, your ICP, and your current competitive environment. Industry benchmarks are useful for orientation. They are not useful for forecasting. When you need to know how much pipeline marketing must generate this quarter, you need your numbers, not a benchmark. Lative runs this same four-knob math on one platform that connects marketing intelligence to sales capacity planning, so the pipeline marketing must generate is reconciled against the capacity sales has to close it.
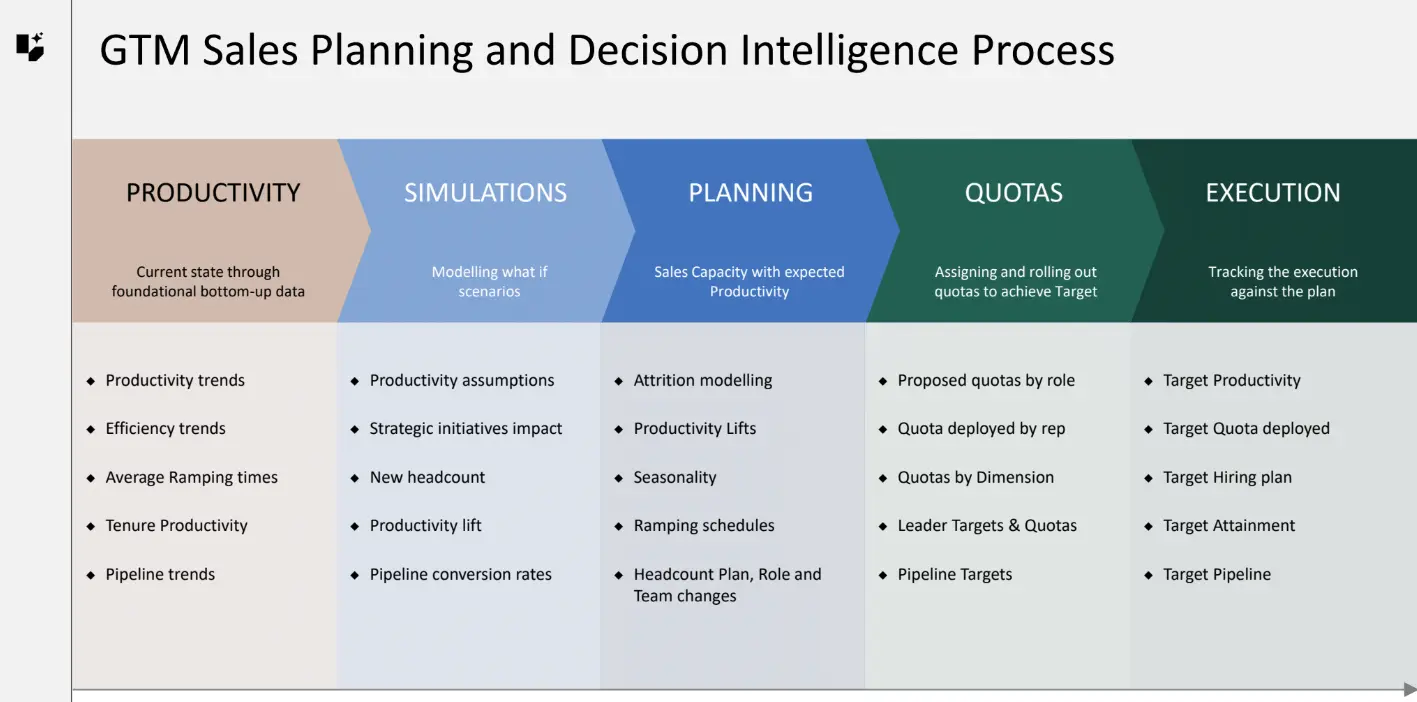
Every capacity model has exactly four variables. Think of them as four knobs:
- Volume: how much demand enters the funnel
- Conversion rates: stage-by-stage, segment-by-segment
- Velocity: how long each stage takes
- ASP and pricing mix: what the average deal is worth
When the plan doesn’t add up, the root cause lives in one of those four places. Every pipeline math conversation is ultimately about which knob moved, and by how much.
Here is how those conversion rates map to the stages your marketing team already owns:
Reached accounts to engaged accounts
What percentage of the accounts your programs reach engage meaningfully? This varies by channel (paid search converts differently from content syndication), by segment (enterprise accounts engage at lower rates but with higher buying committee coverage), and by ICP fit (accounts outside your core ICP engage at a fraction of the rate, polluting the conversion chain for everything downstream).
Engaged accounts to Marketing Qualified Accounts
Of accounts that engage, what percentage reach your sales-ready threshold? If your MQA rate is below 15%, your targeting is too broad. Above 60%, your definition is too conservative and you are leaving qualified accounts out of the pipeline.
MQAs to accepted pipeline
Of accounts handed to sales, what percentage become accepted opportunities within your SLA window? Acceptance rates below 50% signal ICP misalignment. Sales is rejecting what marketing qualified because the two functions have different definitions of ready.
That’s a shared definition problem, and it sits in marketing’s accountability because marketing controls the qualification criteria.
Pipeline to closed-won
Of pipeline generated with marketing involvement, what is the win rate compared to pipeline without marketing coverage? If marketing-influenced pipeline closes at 28% and non-marketing pipeline closes at 19%, marketing’s contribution to revenue has a dollar value attached to it.
That’s not a narrative you build at the end of the quarter. That’s a number you defend in the next budget meeting.
A CMO who knows all four of these rates for their key segments can work backward from any revenue target and define exactly what marketing needs to generate: a manufacturing operation with known input costs and predictable output rates.
This is the same model Lative is built on. Conversion rates, pipeline generation efficiency, and capacity data feed into a single planning layer, shared across marketing, sales, and finance. The math connects directly rather than being reconciled in parallel spreadsheets at quarter-end.
Coverage ratios: start with the truth, not the target
The 3x pipeline coverage ratio is ubiquitous because it is simple. If you need $3M in closed revenue and you close 33% of your pipeline, you need $9M in pipeline. The logic is correct in aggregate. It is wrong as soon as your business has more than one segment with meaningfully different conversion rates, which is why segment-level coverage is the only version of the ratio a CFO can defend.
A business with an enterprise segment closing at 22% and a mid-market segment closing at 41% needs materially different coverage ratios for each. Applying a single 3x assumption across both guarantees you are over-pipelined in one and under-pipelined in the other. The aggregate coverage number looks healthy. The revenue miss arrives on schedule anyway.
Your coverage ratio must be built bottoms-up from your actual conversion rates, then compared against the revenue target as a constraint. Start with the truth: what have your trailing twelve months of conversion data actually shown, by segment and channel? Then bring in the top-down target.
How Lative Tracks Segment-Level Conversion Rates
Lative’s Marketing Intelligence tracks conversion rates and pipeline generation rates by segment in real time, so your coverage ratio is always built on trailing actuals, not assumptions that made sense six months ago.
The gap between what your bottoms-up model predicts and what the target requires is where the real planning happens. Adjusting the coverage ratio to make the math work on paper without changing the underlying assumptions manufactures a plan that fails in Q3.
Your coverage ratio is a function of four inputs: win rate in that segment, average deal velocity (days from opportunity creation to close), pipeline retirement rate (deals that go inactive or are lost), and seasonal pattern (Q4 closes differently than Q2).
Why Segment-Specific Coverage Ratios Matter
Each is segment-specific and changes as your GTM motion matures. A coverage ratio built on last year’s data and applied to this year’s pipeline is directionally useful and operationally unreliable.
Program-level pipeline generation: the number most teams do not track
Beyond the conversion chain, you need program-level pipeline generation rates and a clean read of marketing-sourced pipeline by program type: for every dollar invested in each program, how much pipeline results, and what is the conversion rate by stage on that pipeline? Most marketing teams know what each program costs and how many leads it generated.
They rarely know how much of the pipeline in their CRM traces back to each program type, because that connection requires linking marketing activity to opportunity data in the same model.
When you have program-level rates, the CFO conversation changes. Your webinar program returns $8 of pipeline per dollar invested, with a 28% close rate on webinar-influenced deals. Finance can validate that number against the same opportunity records they use to build the revenue forecast. The budget conversation becomes arithmetic, not advocacy.
Adding $200K to that program changes the Q3 forecast by a calculable amount, because the weighted pipeline view (each opportunity discounted by stage conversion and sales velocity) makes the marginal dollar visible against the revenue target rather than against an MQL count. For a deeper look at how multivariate campaign attribution establishes this connection at the opportunity level, that post covers the methodology.
The three most common pipeline math mistakes
Most pipeline math errors are structural, not analytical. The three mistakes below are not calculation errors. They are the result of measuring the wrong thing or measuring it at the wrong time. Each one produces a plan that looks credible in month one and collapses in month three.
Tracking pipeline at quarter-start instead of continuously
Checking coverage once at quarter-start gives you a snapshot. What you need is a rate you can watch move in real time, so the gap between coverage and target is visible before it becomes a miss. A 3.2x coverage ratio at the start of Q2 that declines to 2.1x by week six is a revenue risk that was visible at week three.
Using gross pipeline instead of net pipeline
Adding $4M in new pipeline while retiring $5M means your revenue base is shrinking. Gross pipeline tells you what marketing added. Net pipeline tells you what the business actually has. For the full picture of how net pipeline signals revenue misses before they land, that post covers the mechanics.
Applying one coverage model to a multi-segment pipeline
If your business sells into financial services (90-day cycles, high ACV, slow procurement) and technology (45-day cycles, lower ACV, faster procurement), running a single coverage model across both means you are wrong about at least one of them at all times. Segment-specific models are the minimum requirement for coverage ratios that actually predict revenue.
The pipeline math that feeds capacity planning and why the Demand Council keeps it current
Demand engine mastery extends past marketing’s boundary into joint capacity planning with sales. The same pipeline math that tells you how much to invest next quarter also tells the CRO how many quota-carrying reps are needed to work the demand that investment will generate.
When the CMO and CRO are working from the same conversion-rate model and the same coverage ratios, capacity decisions connect to demand signals automatically rather than being made in parallel planning processes that never fully sync.
A CMO who raises webinar program spend by $300K can tell the CRO, with the same model, that enterprise pipeline coverage in Q3 will increase by a calculable amount.
Connecting Pipeline Math to Hiring Decisions
That tells the CRO whether existing rep capacity is sufficient or whether a hire needs to happen in Q2 for reps to be productive in Q3. That is a different kind of CMO-CRO conversation than the one most organizations are having.
The pipeline math has to be live, not quarterly. A cross-functional Demand Council, marketing, BDR, sales, and CS leaders meeting weekly, MC’d by RevOps, is how the four knobs get reviewed against the plan in real time. Not a data readout. A summary, the hotspots, the action items.
That weekly rhythm is what turns a capacity plan from an annual exercise into a continuous process. The plan breathes with the business instead of going stale by February.
AskNicely: 30% Cost Per Opportunity in One Quarter
When AskNicely rebuilt their demand engine on Lative’s foundation, they needed a single view of conversion rates, pipeline generation efficiency, and capacity across marketing, sales, and finance. They cut cost per opportunity by 30% in one quarter.
Segment-specific conversion rates, program-level pipeline generation data, and a shared data foundation were the architecture. The math did the rest.
Lative’s Marketing Intelligence tracks conversion rates, pipeline generation efficiency, and weekly marketing KPIs by segment, and feeds the same data foundation into the sales capacity planning model.
Key takeaways
- Coverage ratios calculated segment by segment surface a missed quarter weeks before the aggregate does.
- Program-level pipeline generation is the conversion-rate input most plans skip and most boards never ask about.
- Capacity planning that breathes with the data, not a static spreadsheet, is what closes the strategy-to-execution gap.
- A weekly Demand Council with one shared revenue model turns pipeline math into the single language marketing and sales argue in.
From Aggregate Coverage to Segment-Level Precision
If you are still calculating pipeline coverage in aggregate rather than by segment, the missed quarter is already visible in the data. See how Lative gives you segment-level pipeline coverage ratios and demand engine math your CFO can verify.
Frequently asked
What is the right pipeline coverage ratio for a multi-segment B2B business?
There is no single right ratio. Coverage is a function of segment-level win rate, deal velocity, retirement rate, and seasonality. An enterprise segment closing at 22% needs a different ratio than a mid-market segment closing at 41%, and applying a single aggregate 3x assumption across both guarantees you are over-pipelined in one and under-pipelined in the other. Build the ratio bottoms-up from trailing twelve months of segment-level conversion data, then compare against the revenue target.
How does program-level pipeline generation change the CFO conversation?
It turns the budget conversation into arithmetic. When you can show that your webinar program returns $8 of pipeline per dollar invested with a 28% close rate on webinar-influenced deals, finance can validate the number against the same opportunity records they use to build the revenue forecast. Adding $200K to that program then translates to a calculable Q3 forecast change rather than a marketing claim that needs defending.
Why track net pipeline instead of gross pipeline added?
Gross pipeline tells you what marketing added in the period. Net pipeline (gross added minus pipeline retired) tells you what the business actually has to close against. Adding $4M while retiring $5M is a shrinking revenue base, and the gross view hides that for a full quarter. Net pipeline is the leading indicator of a revenue miss; gross coverage almost always catches it late.
Werner Schmidt — Werner Schmidt is the CEO and Co-founder of Lative, with over 20 years of experience in Revenue Operations with companies including Forcepoint, Aruba Networks, Citrix, and Sage.