Your CRM has the numbers. Your spreadsheet has a formula. The problem is the formula uses last quarter’s conversion rate from a segment that no longer exists at the same size.
The enterprise team doubled. The SMB team shrank. The mix shifted. But the formula in the spreadsheet still runs on the blended average you calculated in January, which means every output is systematically wrong in a direction you cannot easily detect.
Average quota attainment across SaaS was 42.69% in Q2 2025, according to RepVue’s Q2 2025 Cloud Sales Index of 47,000 quota-carrying reps across 246 companies. A significant portion of that miss traces back to capacity plans built on stale inputs. The formula was correct. The inputs were not.
When teams ask how to calculate sales capacity correctly, the answer almost always comes down to the inputs, not the formula. Lative’s Sales Capacity Planning module recalculates sales capacity on trailing actuals by segment. The formula updates as the business changes, not once a year. Here is the formula, and here is how to apply it correctly.
The sales capacity formula
Sales capacity calculation starts with two core equations. Everything else is a refinement of these two.
Productive Capacity = Active Reps x Avg Quota Attainment x ACV
Pipeline Required = Revenue Target / Win Rate
Productive capacity tells you how much revenue your current team can actually generate, given how they have historically performed. Pipeline required tells you how much pipeline you need to feed that capacity and hit the target. The gap between what your productive capacity implies and what the target demands is the number your plan must close.
Note what is absent from these formulas: headcount. Headcount is not capacity. Ten reps with a $1M quota each do not represent $10M in productive capacity. They represent $10M in quota. Productive capacity requires the attainment adjustment. A team averaging 43% attainment against $10M in quota has $4.3M in productive capacity, not $10M.
Headcount math
- Counts heads: ten reps reads as ten units of capacity
- $10M in quota looks like $10M in capacity
- Ignores attainment and ramp entirely
Productive capacity
- Quota multiplied by trailing attainment
- $10M quota at 43% attainment is $4.3M of real capacity
- Ramping reps modeled separately on a real curve
The activity-based alternative
If you do not yet have clean quota-attainment history, you can approximate capacity from the funnel instead. The activity-based method works bottom-up from rep activity:
Deals per Period = Opportunities Worked x Close Rate
Monthly Sales Capacity = Deals per Period x Average Deal Size
This is the same logic in different clothing, “close rate x deal size” is just attainment and ASP expressed through the funnel. Use the quota-attainment version when you have reliable trailing attainment data; use the activity version for new teams or new segments where attainment history does not exist yet. One terminology note: many finance models call the attainment factor the sales productivity rate. Same number, different label, the percentage of quota a ramped rep actually closes.
Step-by-step calculation
Here is how to run this calculation for a real business. Each step must be done by segment, not in aggregate.
Calculate per-rep productive capacity
For each fully ramped rep, take their individual quota and multiply it by their trailing four-quarter attainment rate. Sum across all fully ramped reps in the segment. Exclude reps still in ramp and model them separately using your validated ramp curve by month. A rep in month three of a six-month ramp contributes approximately 25–30% of their quota, not 50%, in most enterprise motions.
Segment by deal type
Never blend SMB, mid-market, and enterprise into a single pool. Each segment has its own win rate, its own average selling price, its own cycle length, and its own ramp curve. Blending them produces a rate that accurately describes none of them. Run the formula separately for each named segment and sum the outputs at the end.
Apply segment conversion rates
For each segment, apply the stage-to-stage conversion rates from your CRM, drawn from trailing actuals. The win rate you need here is not the overall close rate.
It is the rate at which opportunities that enter your pipeline at Stage 1 convert to closed-won, by segment. This is the denominator in Pipeline Required = Revenue Target / Win Rate. Getting this wrong by five percentage points changes your pipeline coverage requirement by 20–30%.
Sum to portfolio
Once you have productive capacity and pipeline required for each segment, sum them to the portfolio level. The portfolio view is what goes to the board. The segment view is what tells you where the gaps are and which lever to pull. Never start with the portfolio number and work down. Start with the segments and work up.
A worked example
Consider a fictitious B2B SaaS company at Series B. Call them Acme Revenue. They have two segments: mid-market and enterprise.
- Mid-market: 8 fully ramped reps, $600K quota each, 58% trailing attainment, $48K ACV, 24% win rate
- Enterprise: 5 fully ramped reps, $1.2M quota each, 41% trailing attainment, $120K ACV, 13% win rate
- Ramp: 3 mid-market reps hired in Q1, month 4 of 5-month ramp (contributing ~60%); 2 enterprise reps hired in Q2, month 2 of 8-month ramp (contributing ~15%)
Mid-market productive capacity: 8 reps x $600K x 58% = $2.78M, plus 3 ramping reps x $600K x 60% = $1.08M. Total mid-market: $3.86M.
Enterprise productive capacity: 5 reps x $1.2M x 41% = $2.46M, plus 2 ramping reps x $1.2M x 15% = $360K. Total enterprise: $2.82M.
Portfolio productive capacity: $6.68M.
Now, the board target is $9M. The gap is $2.32M. To close through pipeline alone, at mid-market win rates of 24%, you need $9.67M in additional mid-market pipeline, or at enterprise win rates of 13%, you need $17.8M in additional enterprise pipeline.
The asks are different. The mid-market gap is closeable with a focused campaign. The enterprise gap requires either a hiring decision or a win-rate improvement program that takes six months to show results.
This is the conversation the Oh Sh*t meeting is designed to have. Not a debate about whether the numbers are right. A decision about which lever to pull.
Why the formula breaks in practice
The math in the formula is straightforward. The failure modes are in the inputs.
Using blended conversion rates
A blended 19% win rate that averages a 24% mid-market rate and a 13% enterprise rate will produce a pipeline coverage requirement that looks sufficient in aggregate while running a structural deficit in enterprise. The CRO sees 3.2x overall coverage and feels comfortable. Enterprise pipeline is actually at 1.7x. The quarter misses on enterprise and the post-mortem blames execution.
Ignoring ramp
Modeling new hires at full productive capacity from day one or at a flat 50% ramp rate overstates capacity. Ramp curves are not linear. In most B2B SaaS companies, months one through three of a ramp produce minimal closed revenue.
The big jump in productivity happens between month four and month seven for mid-market motions, later for enterprise. Build your ramp model from cohort data, not assumptions.
Annual instead of rolling calculation
A capacity model run once per year is stale by Q2. Every hire that slips, every rep who leaves, every shift in conversion rates changes the calculation.
The model needs to run on trailing actuals, updated at least monthly, ideally on a rolling four-quarter basis. A static annual model cannot tell you when a coverage decline is developing, only that it already happened when you review it in the next planning cycle.
Validating the inputs each quarter
One closing discipline keeps the whole calculation trustworthy: a quarterly input audit. Re-pull trailing attainment by segment and check it moved less than two points from the model’s assumption; re-derive the ramp curve from the most recent two cohorts rather than carrying last year’s; and spot-check a sample of close dates against reality, because auto-rolled dates quietly corrupt every conversion rate downstream. The audit takes an hour. Skipping it is how a correctly built capacity model becomes a confidently wrong one within two quarters, and why the calculation is a cadence, not a project.
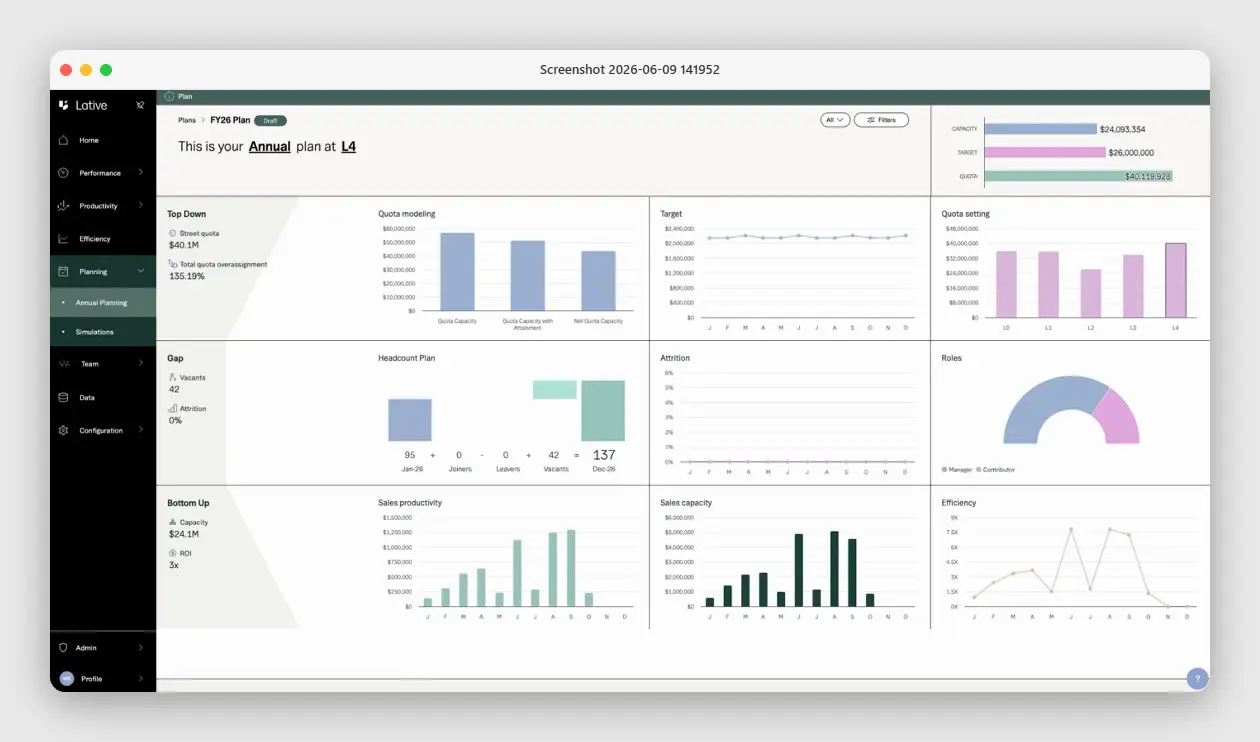
How Lative runs this calculation
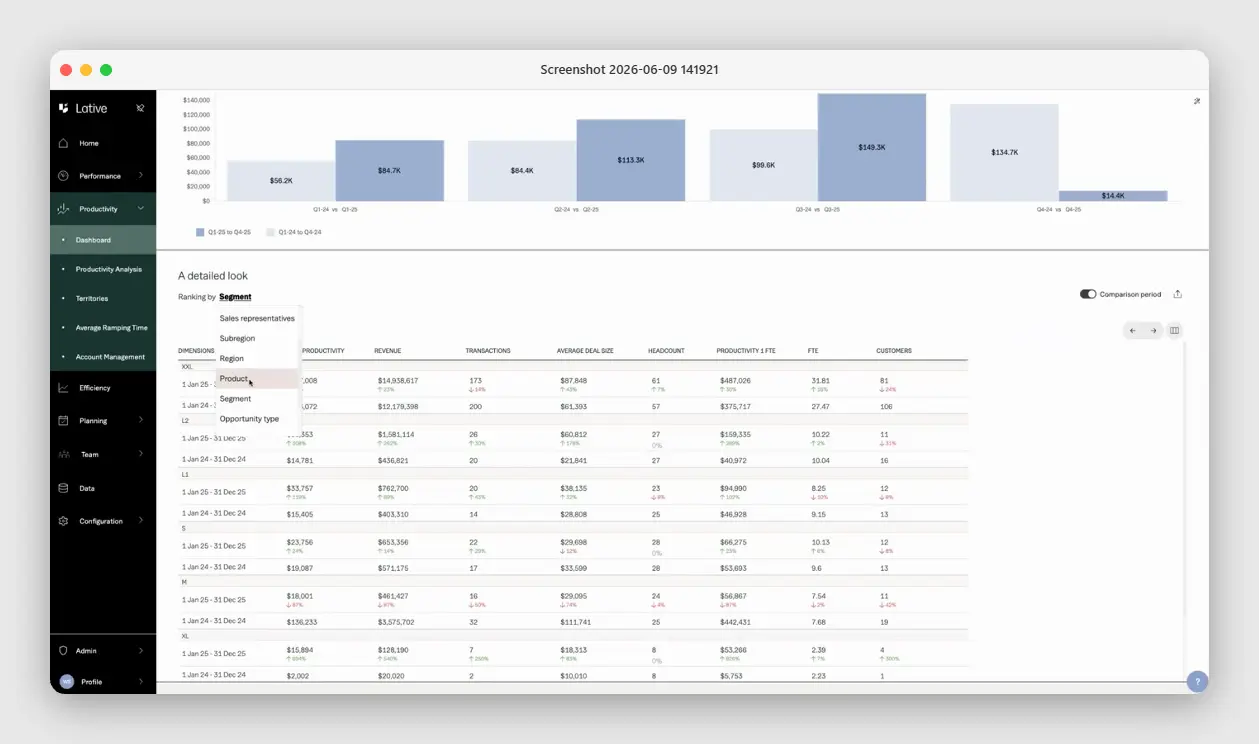
Lative runs this exact calculation across three connected modules. Its Productivity module computes production per rep from your closed-won data, broken out by segment, product line, and opportunity type rather than one blended pool. Average Ramping Time derives each ramp curve from real cohort hire dates instead of a flat assumption. The Capacity view then sums productive capacity per rep and team and reconciles it against your target and quota, drawn from the same Salesforce data your CRO uses to run the weekly pipeline review.

The key difference from a spreadsheet model: the calculation updates on trailing actuals continuously. When a rep’s attainment rate shifts, the model reflects it in the next week’s capacity output, not the next planning cycle.
When a new hire’s ramp curve diverges from the model assumption, the system flags it. When the enterprise pipeline coverage ratio falls below plan, that appears in the same view as the capacity model that set the coverage requirement.
The formula is the same one described above. The difference is the inputs are live, segmented, and sourced from a single data foundation rather than copied between spreadsheets and CRM exports. For how Lative applies AI-native opportunity scoring to pipeline coverage, see AI-Native Pipeline Coverage and Opportunity Scoring.
Key takeaways
- Capacity = active reps × trailing attainment × ACV; headcount alone overstates it.
- Calculate by segment and sum up; a blended rate hides an enterprise deficit inside a healthy aggregate.
- Model ramping reps on a real ramp curve, not a flat 50%.
- Run it monthly on trailing actuals; a model built once a year is stale by Q2.
Frequently asked
What is the sales capacity formula?
Productive Capacity = Active Reps × Average Quota Attainment × ACV, and Pipeline Required = Revenue Target ÷ Win Rate. The first tells you what the team can generate; the second tells you how much pipeline feeds it.
How is sales capacity different from headcount?
Headcount counts people; capacity counts productive output. Ten reps with a $1M quota each are $10M in quota, but at 43% attainment only $4.3M in productive capacity. The attainment adjustment is the whole point.
Should sales capacity be calculated by segment?
Always. SMB, mid-market, and enterprise have different win rates, ACVs, cycle lengths, and ramp curves. A blended rate accurately describes none of them. Run the formula per segment and sum up.
How often should you recalculate sales capacity?
Monthly at minimum, on a rolling four-quarter basis. A model run once a year is stale by Q2 as hires slip, reps leave, and conversion rates move.
How do you account for ramping reps in capacity?
Model them separately on a validated ramp curve. A rep in month three of a six-month ramp contributes roughly 25–30% of quota, not 50%, in most enterprise motions.
See how to calculate sales capacity in real time using Lative’s Planning module.
Werner Schmidt is the CEO and Co-founder of Lative, with over 20 years of experience in Revenue Operations with companies including Forcepoint, Aruba Networks, Citrix, and Sage.