The most common capacity planning failure I’ve seen starts with the board’s target number and works backwards. The team takes the revenue target, divides it by average ACV, gets a deal count, divides by an assumed win rate, and calls the result a capacity plan.
That is a justification exercise, not a capacity plan. The inputs get adjusted until the output matches the target, and the plan goes to the board with numbers that look credible but have no connection to how the business actually performs.
The Ebsta x Pavilion 2024 analysis of 4.2 million opportunities found that teams adopting a RevOps-driven planning approach achieved 87% higher win rates and 21% shorter sales cycles than peers running without that infrastructure. The difference comes down to whether the plan was built from the truth or from the target.
If you want to know how to build a sales capacity plan that holds through Q4, the answer is: start with the truth, not the target. Lative’s Sales Capacity Planning module runs the bottoms-up model on your trailing actuals and shows the gap before the Oh Sh*t meeting.
The steps below are the framework I use, and that Lative operationalizes, to build a plan that holds through the year rather than falling apart by Q2.
Before you start: the inputs you need
A capacity plan is only as accurate as its inputs. Get these wrong and the math is precise but meaningless. Three categories of inputs matter above all others:
- Headcount and ramp curves: Active rep count by segment and tenure, plus hire dates and historical ramp actuals by segment
- Conversion rates by segment: Stage-to-stage rates for each segment separately, not a blended pipeline average
- ASP and sales cycle velocity: Average contract value and time-in-stage data from trailing actuals, not benchmarks
Headcount plan and ramp curves
You need two things from headcount: the current count of active reps by segment and tenure bucket, and the hire plan by quarter with expected start dates.
Ramp curves must come from your trailing actuals by segment, not from industry benchmarks. If your enterprise reps historically take eight months to reach full productivity, using a six-month benchmark overstates your capacity by two months per hire across every cohort.
Conversion rates by segment
Blended conversion rates across your entire pipeline are useless for capacity planning. You need stage-to-stage conversion rates broken out by segment, deal size, and ideally by lead source. A blended win rate of 22% that averages a 31% SMB win rate and a 14% enterprise win rate will produce a plan that is wrong in both segments simultaneously.
Pipeline by source
Know where your pipeline comes from and what it converts at by source. Inbound and outbound typically convert differently. Partner-sourced and marketing-sourced pipeline have different velocity profiles. A capacity plan that treats pipeline as a single pool will hit its coverage number on paper while running a structural deficit in the segments that actually need coverage.
Step 1: Build the bottoms-up model
Start with what you have, not with what you need. The bottoms-up model begins with your current reps and asks a simple question: given these people, at their current productivity rates, in their current territories, what revenue can we actually generate this year?
Calculate productive capacity per rep
For each rep, productive capacity = quota x trailing attainment rate, adjusted for ramp stage. A fully ramped rep with a $1.2M quota and a 78% trailing attainment rate contributes $936K to your capacity model. A rep hired three months ago with a six-month ramp contributes roughly 20–30% of their quota, not 50%, because ramp curves front-load relationship building and back-load revenue.

Multiply by segment conversion rates
Apply your segment-specific conversion rates to the pipeline requirement that falls out of the productive capacity calculation. If your enterprise reps have a 14% win rate and their combined productive capacity is $4.2M, you need $30M in enterprise pipeline to close that number. If you have $18M, you have a $12M pipeline gap in enterprise before you factor in hiring.
Get the pipeline requirement
Sum the pipeline requirements across all segments. This is your real coverage number, not a multiple of revenue target, but the actual pipeline you need given your specific conversion rates and rep productivity. Write it down. This is the number the rest of the plan is built to address.
Step 2: Overlay the top-down target
Now bring in the board’s number. Place the bottoms-up model and the top-down target side by side and read the gap. This is a fact, not a negotiation point. The gap tells you how much additional capacity you need to acquire, either through hiring, through pipeline generation, or through improving conversion rates. All three are available. None of them are free.
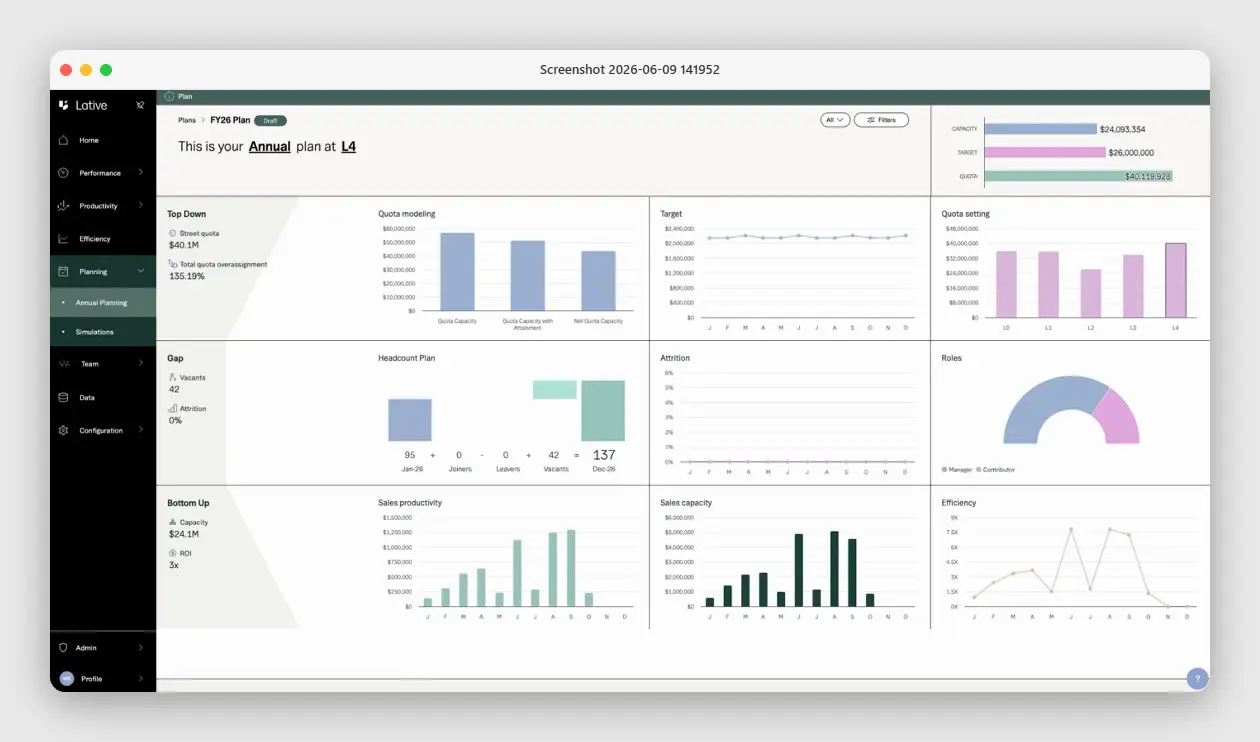
Lative’s Annual Planning view does exactly this on one screen: top-down quota and target on top, bottom-up productivity and capacity beneath, and the gap, with the headcount and attrition that drive it, in between.
Quantify the gap
The gap is $8M in revenue. To close it through hiring alone, at current ramp times and productivity rates, you need six net-new reps producing at full capacity, which means hiring them in Q1 to have any contribution by Q4. That hire plan costs $X in salary before a dollar of revenue closes. Run those numbers explicitly. The gap has a cost. The board needs to see it.
Convert the gap into a hiring number
Turn the gap into reps explicitly rather than eyeballing it: Reps Needed = Capacity Gap ÷ (Fully Ramped Quota x Expected Attainment). A $8M gap against a $1.2M quota at 70% expected attainment implies roughly ten fully productive reps. Then adjust for ramp: a rep hired mid-year contributes only a fraction of annual capacity, so the number you actually hire is always higher than the raw division suggests. This is the step most plans skip, they hire to the raw number, the new cohort ramps slower than assumed, and the gap reopens in Q3.
Identify which knob moves it
I use four knobs to close a capacity gap: volume (more pipeline), conversion rates (better win rate or stage progression), velocity (shorter sales cycle), and ASP (larger average selling price). Each knob has a different cost structure, a different time horizon, and a different owner. Choosing the right combination is a strategic decision, not a math problem.
Assign owners
Every gap-closing lever needs a named owner and a deadline. Pipeline volume goes to marketing and SDR leadership. Conversion improvement goes to sales enablement and the segment VP. Velocity often goes to RevOps to find the stuck stages. ASP goes to the product and commercial teams. Unowned levers do not close gaps.
Step 3: Run the Oh Sh*t meeting
The Oh Sh*t meeting is the cross-functional session where the bottoms-up model and the top-down target sit in the same room and the gap is read out loud. This meeting exists because capacity gaps that are visible in the model in February can still be closed by Q4. The same gap, first seen in October, cannot be closed. The meeting is not optional.
What the meeting is for
The Oh Sh*t meeting is for deciding which levers to pull, in what order, by what date, with what investment. It is a decision session. The output is a gap-closing plan with owners, timelines, and budget implications. Every participant leaves with an action and a deadline.
What it is NOT for
This meeting is about what to do about the gap, not whether to believe it. Skip the bottoms-up re-run, the forecast debate, the search for a more favorable interpretation. The gap is a fact produced by your own data. Come with an action plan.
Who runs it
The CRO runs it or delegates it to RevOps, who presents the model. The CRO, CMO, VP of Sales, VP of Marketing, and CFO attend. Finance attends because the gap-closing decisions have budget implications that need real-time approval, not a two-week approval cycle after the meeting ends.
Step 4: Launch the Demand Council cadence
The capacity plan lives as a cadence, not a static document. The Demand Council is the weekly cross-functional rhythm that keeps the plan alive and visible between the annual plan and the next board meeting. Without this cadence, the plan is stale within six weeks of being written.
Weekly rhythm
The Demand Council meets weekly. The agenda covers three things: pipeline by segment versus coverage requirement, conversion rates versus plan, and hiring versus model assumptions. Each item is flagged green, yellow, or red. Yellow and red items get owners and dates. Green items get noted and moved past. The meeting runs 45 minutes.
Who attends
Marketing, sales leadership, SDR leadership, and RevOps. Finance attends monthly for the deeper model review. The test for whether someone should be in the meeting: do they own a lever that appears in the capacity model? If yes, they attend. If no, they do not.
What gets reviewed
Pipeline generation versus weekly target, by source and segment. Stage progression rates against the previous four-week average. Rep attainment against pace-to-quota, flagging anyone falling more than 15% below pace at the eight-week mark. Hiring progress against the model’s headcount assumptions.
Common mistakes
I was part of most of these mistakes before I learned to build plans differently. They are worth naming explicitly because they are consistent across companies at every stage.
Sizing the team with a rule-of-thumb shortcut
Three shortcuts show up constantly, and all three break at scale: dividing the team target by headcount to set a quota, applying a fixed multiple of OTE (the “5x OTE” rule) to size quota, and assuming a flat coverage multiple regardless of win rate. Each one skips the productive-capacity step entirely. They are fast, and they feel rigorous because they produce a clean number, but they are wrong the moment your ramp, win rate, or segment mix differs from the average the rule was built on. Use them as a sanity check against the bottoms-up model, never as a substitute for it.
Using last year’s conversion rates
Market conditions, ICP, and sales motion change. Last year’s conversion rates applied to this year’s pipeline produce a plan that is wrong before it starts. Use trailing actuals from the most recent two to four quarters, weighted toward recent performance.
Ignoring segment differences
Blended rates hide structural problems. A plan that shows adequate coverage in aggregate while running a 40% deficit in enterprise and a 60% surplus in SMB will miss enterprise targets consistently while over-investing in SMB motion. Segment the model. Segment the pipeline. Segment the attainment tracking.
Planning annually instead of continuously
An annual spreadsheet is wrong by Q2. Not because the planning was bad, but because businesses change faster than annual plans can absorb. For how to build a world-class demand engine that feeds the capacity model, see How to Build a World-Class Demand Engine.
Hiring slips. Pipeline mix shifts. A top rep leaves. The capacity model needs to reflect current reality, not January’s assumptions. That requires a live model updated on trailing actuals, not a spreadsheet refreshed at the next annual cycle.
If you want to know how to build a sales capacity plan that survives Q2, the answer is a live model updated on trailing actuals. If yours is a spreadsheet refreshed once a year, it is wrong before June. See how Lative makes planning continuous.
Werner Schmidt is the CEO and Co-founder of Lative, with over 20 years of experience in Revenue Operations with companies including Forcepoint, Aruba Networks, Citrix, and Sage.