I’ve been in the board review where the pipeline number changes on slide three. The VP of Sales is working from a Salesforce report pulled last Tuesday.
The CFO is working from a spreadsheet the RevOps team exported Thursday morning. The CRO has a number somewhere between both. By the time someone asks whether coverage is actually sufficient to close the quarter, the conversation has collapsed into a debate about whose export is fresher, and nobody answers the original question.
What pipeline coverage is supposed to answer is straightforward: do you have enough pipeline to close your revenue target? The math behind it is simple. The discipline required to make it trustworthy is not.
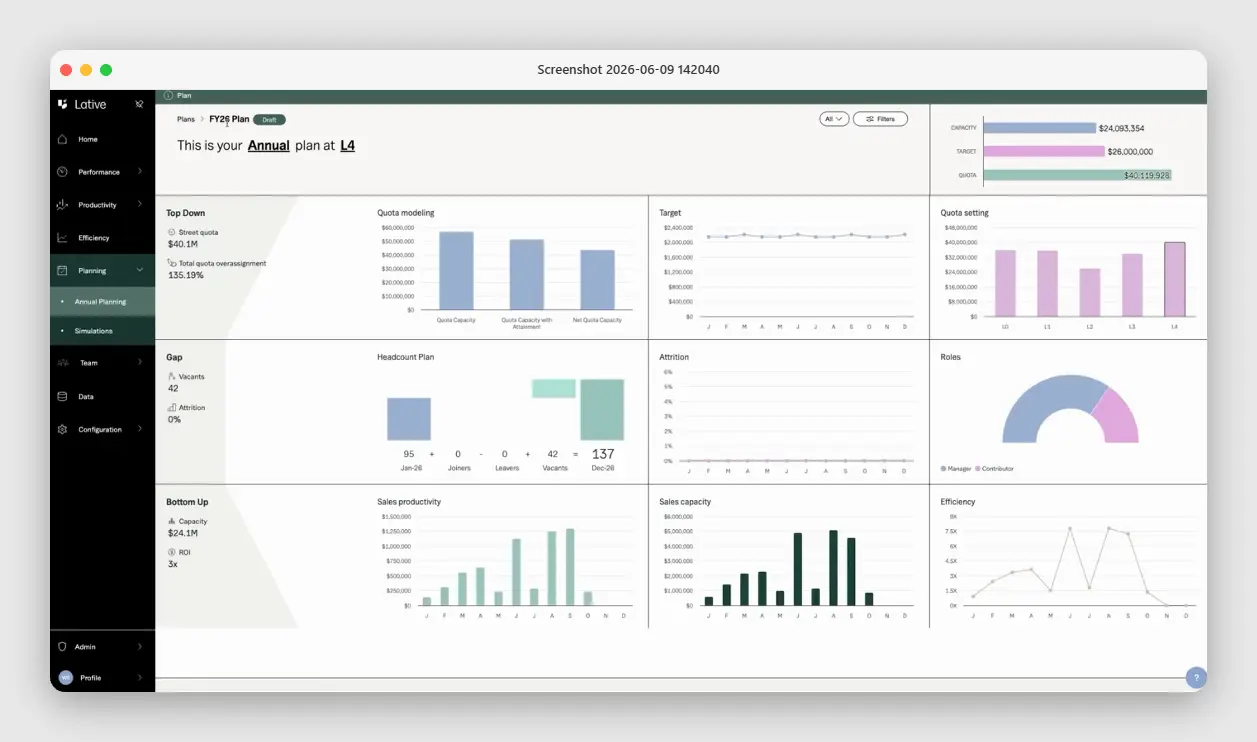
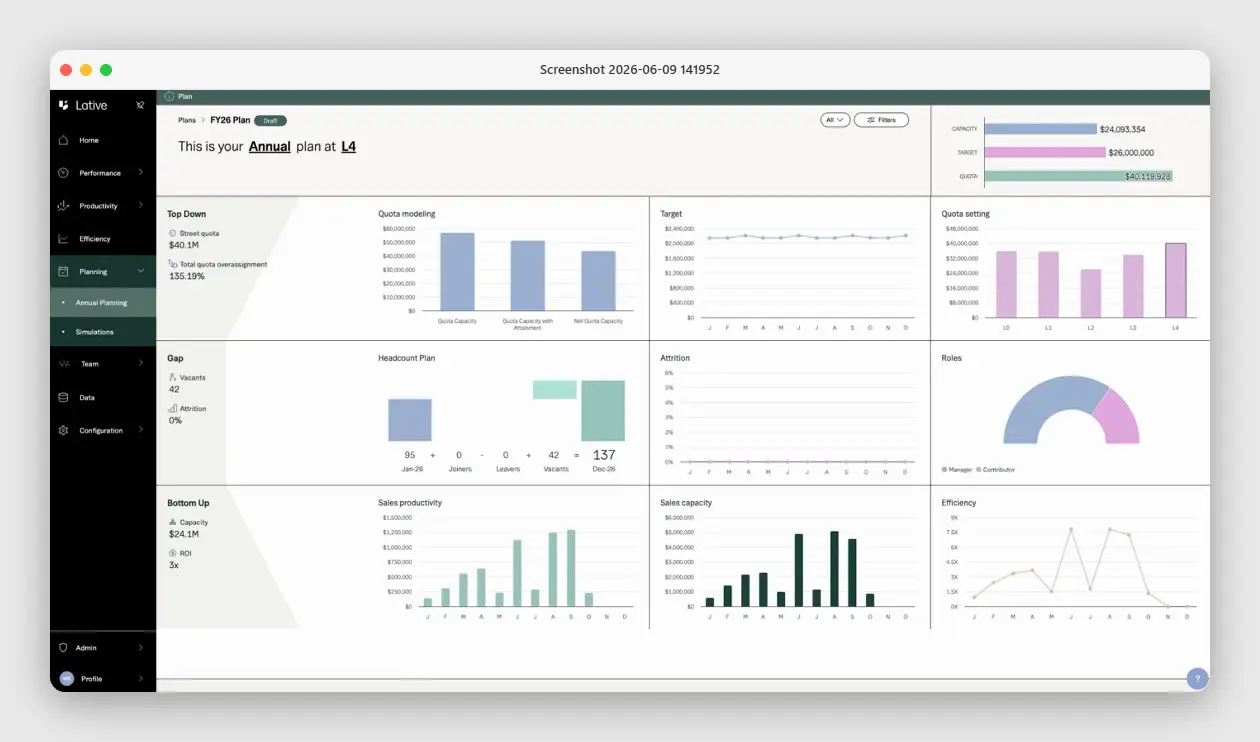
Lative’s Sales Capacity Planning module calculates pipeline coverage ratios by segment, territory, and rep cohort in real time, pulling from the same Salesforce data your CRO uses, so the number on the board slide matches the number in the operating review.
The AI-native pipeline coverage layer adds opportunity scoring on top, surfacing which deals in that coverage ratio are actually likely to close.
What is pipeline coverage
Pipeline coverage is the ratio of total open pipeline value to the revenue target for a defined period. A coverage ratio of 3x means you have three dollars of open pipeline for every one dollar of revenue target. It is a leading indicator: coverage measured at the start of a quarter tells you whether you have enough opportunity in the funnel to close your number, given your historical win rate.
How to calculate pipeline coverage
The formula:
Pipeline Coverage Ratio = Total Open Pipeline Value ÷ Revenue Target
Your Q3 revenue target is $2M. Your open pipeline at quarter start is $7.2M. Your pipeline coverage ratio is 3.6x.
The ratio is only meaningful when the denominator is right. Revenue target should reflect productive capacity, not the investor model quota, not the CFO’s top-down number, but the target your bottoms-up capacity plan supports. A 3.6x ratio against an unattainable quota tells you nothing useful. A 3.6x ratio against a grounded target tells you whether you can close the quarter.
Coverage should also be calculated by segment, not just in aggregate. An enterprise coverage ratio of 4x hiding a mid-market ratio of 1.8x is a revenue risk that the aggregate number obscures entirely.
Weighted vs. unweighted pipeline coverage
The formula above uses unweighted pipeline, the full face value of every open opportunity, counted as if it will close. It is the fastest number to pull and the easiest to fool yourself with. A weighted pipeline adjusts each deal by its probability of closing, usually by stage: a late-stage deal in negotiation might count at 80% of its value, a Stage 1 opportunity at 10%.
Unweighted coverage answers “how much is in the funnel.” Weighted coverage answers “how much is realistically going to convert.” Use unweighted for a fast top-of-funnel health check; use weighted when you are turning coverage into a forecast. The catch: weighted coverage is only as honest as your stage probabilities, and most CRMs run on stage definitions nobody has audited in a year. A weighted number built on guessed probabilities is just a more confident version of a wrong number, which is why the capacity model should derive stage weights from actual historical conversion rates, not rep optimism.
Unweighted coverage
- Counts every open deal at full face value
- Fast to pull, easy to fool yourself with
- Answers only how much is in the funnel
Weighted coverage
- Adjusts each deal by its real close probability
- Stage weights derived from historical conversion, not rep optimism
- Answers how much is realistically going to convert
Pipeline coverage benchmarks by company stage
The widely cited “3x rule” for pipeline coverage originates from an era when B2B win rates averaged around 33%. Landbase’s 2026 analysis of win rate benchmarks found that the average B2B win rate is now 21% across all opportunities and 29% for qualified pipeline. At those win rates, a 3x coverage ratio is insufficient. The benchmarks by stage reflect this shift:
- Seed / Pre-Series A: Coverage ratios are less meaningful at this stage because deal cycles are long, sample sizes are small, and win rate data is unreliable. Track pipeline-to-target ratio, but weight individual deal qualification heavily over aggregate coverage math.
- Series A ($1M–10M ARR): A coverage ratio of 3x–4x is appropriate as you establish win rate baselines. Segment enterprise and SMB separately, they close at materially different rates and need separate coverage targets.
- Series B ($10M–30M ARR): With more deal history and longer average sales cycles, 4x–5x coverage becomes the minimum threshold in enterprise segments. Mid-market can often be managed at 3x–4x if velocity is higher.
- Series C+ ($30M+ ARR): Enterprise pipeline coverage targets of 4x–5x are standard. Organizations with complex multi-product motions or long procurement cycles sometimes operate at 5x–6x to maintain forecast confidence across a full quarter.
Why pipeline coverage matters for capacity planning
Pipeline coverage is a lagging output of capacity planning, not an input. You do not set a coverage ratio target and hope the pipeline appears. You build a capacity model, using the 4 Knobs of volume, conversion rates, velocity, and ASP, that generates the pipeline generation rate required to sustain a healthy coverage ratio throughout the quarter.
A 3.2x coverage ratio at quarter start that declines to 2.1x by week six is a revenue miss that was visible at week three. The coverage ratio is moving in the wrong direction, and the capacity model should surface that signal before it becomes a forecast problem. That requires week-over-week coverage tracking, not a snapshot at quarter open and quarter close.
Lative’s Sales Capacity Planning module tracks pipeline coverage at weekly and monthly granularity, by segment, territory, and rep cohort, in the same Annual Planning view that holds capacity, quota, and pipeline velocity, so coverage is read against the target your bottoms-up plan actually supports.
When coverage starts declining mid-quarter, the model flags it against the demand engine inputs so your CRO can see whether the coverage decline is a pipeline generation problem, a conversion problem, or a deal velocity problem. Each has a different response. Getting the diagnosis right before week eight is what separates a plan correction from a miss.
How to increase pipeline coverage
When coverage runs short, the reflex is “generate more pipeline.” That is one lever of four, and usually not the cheapest. You can close a coverage gap by moving any of the 4 Knobs:
- Volume: generate more qualified pipeline through outbound and demand gen. Effective, but the slowest and most expensive lever, and it inflates coverage with junk if qualification is loose.
- Conversion rate: improve win rate or stage progression. A higher win rate lowers the coverage ratio you need in the first place, often the highest-leverage move on this list.
- Velocity: shorten the sales cycle so pipeline replenishes faster within the period.
- ASP: raise average deal size so the same number of deals covers more of the target.
Before you add pipeline, clean it. Coverage built on stalled, unqualified, or zombie deals is a number that lies to you. The fastest way to “increase” real coverage is often to strip out the deals that were never going to close and fix the qualification bar that let them in.
Common pipeline coverage mistakes
Pipeline coverage fails most often not in the formula but in how the formula is applied.
Measuring coverage against gross pipeline instead of qualified pipeline
Gross pipeline counts every open opportunity regardless of stage or qualification status. A 4x gross coverage ratio with 60% of deals in Stage 1 is not 4x coverage, it is 1.6x coverage of stage-weighted, closeable pipeline. Measure coverage against opportunities that have passed your qualification threshold, and weight late-stage deals more heavily when building confidence in the number.
Using a single aggregate ratio across all segments
The board slides show 3.8x coverage. Enterprise is at 5.1x. Mid-market is at 1.9x. The aggregate masks a mid-market coverage crisis that is going to produce a miss in six weeks. Coverage ratios are only actionable when broken down by the segments your quota is set against. An aggregate ratio is a headline, not a diagnostic tool.
Applying a fixed coverage target without calibrating to your win rate
The 3x rule assumes a 33% win rate. If your win rate is 21%, close to the current B2B average, you need closer to 4.8x coverage to produce the same expected closed revenue.
Using a coverage target inherited from a different era, a different company, or a different sales motion produces confidence in a number disconnected from your actual conversion math. Derive the right coverage target from your historical win rate by segment, not borrowed from an industry heuristic.
Key takeaways
- Pipeline coverage answers one question: do you have enough pipeline to close the target?
- The ratio is only honest when the denominator is a capacity-grounded target and the pipeline is qualified.
- Always break coverage out by segment; an aggregate ratio hides a mid-market crisis.
- The 3x rule assumed a 33% win rate; at 21% you need closer to 4.8x to produce the same closed revenue.
Frequently asked
What is a good pipeline coverage ratio?
For most B2B SaaS companies at Series B and beyond, 4x–5x qualified pipeline coverage is the target for enterprise segments. The right number depends on your win rate, sales cycle, and deal velocity, not an industry benchmark borrowed from a different motion.
What is 4x pipeline coverage?
A 4x ratio means four dollars of open pipeline for every dollar of revenue target. Whether that is enough depends on win rate: at 25% it is roughly break-even; at a 21% win rate, closer to the current B2B average, you need nearer 4.8x for the same expected closed revenue.
How often should you measure pipeline coverage?
Weekly at minimum. A quarter-open snapshot and a quarter-close review miss the mid-quarter signal that tells you whether the coverage trajectory is sustainable or declining toward a miss.
What is the difference between pipeline coverage and pipeline velocity?
Coverage measures how much pipeline you have relative to target; velocity measures how fast it moves through stages. Coverage tells you if you have enough; velocity tells you if it will close in time.
What is the difference between pipeline coverage and forecast coverage?
Pipeline coverage measures all open pipeline against target. Forecast coverage is narrower: only the deals you commit to close this period. Coverage tells you what is possible; forecast coverage tells you what is probable.
Why does pipeline coverage differ between sales and finance?
Sales measures against the quota it manages to; Finance measures against the revenue target in the investor model. When those numbers differ, coverage ratios diverge. The fix is a shared data model, not a better export schedule.
What is pipeline coverage in the context of the 4 Knobs?
Coverage is a function of all four Knobs: volume, conversion rates, velocity, and ASP. Changing any one Knob changes the coverage ratio required to hit target.
If your last board review had a different pipeline coverage number in every slide, that disagreement has a data model answer. See how Lative’s Sales Capacity Planning module gives your CRO and CFO a shared number. Book a demo.
Werner Schmidt is the CEO and Co-founder of Lative, with over 20 years of experience in Revenue Operations with companies including Forcepoint, Aruba Networks, Citrix, and Sage.