A sales territory plan template helps you divide your market into balanced, winnable patches and assign them fairly, and the fairness is the point.
Unequal territories are the most common hidden cause of unequal attainment: The Bridge Group’s 2024 SaaS AE Metrics Report (n=419 SaaS companies) found only 51% of AEs hit quota in 2024, and inside almost every low-attainment team is a set of patches that were never equal to their numbers.
This free template gives you a structured framework for designing territories by geography, segment, or named accounts, scoring them on real opportunity, and checking each one for balance, built for B2B SaaS teams in Excel and Google Sheets. The guide below covers what the template includes, the five-pass fill process, a worked rebalancing example, and the limits at which the spreadsheet hands off to a connected model.
What the template includes
- Account universe tab. Every account with segment, size band, industry, region, current owner, and an opportunity score: realistic annual revenue potential based on win rates and deal sizes for lookalike accounts.
- Territory definition tab. Each patch with its model (geographic, vertical, segment, named accounts), assigned rep, summed opportunity score, and the balance check against quota.
- Coverage check. Flags for unowned accounts, double-owned accounts, and patches below the opportunity threshold, the three silent leaks in most designs.
- Quota linkage column. Each territory’s scored potential expressed as a multiple of its quota, with a 3 to 5x target band, so coverage and targets are designed together rather than discovered apart.
- Transition tracker. For redraws: which accounts moved, the handoff status, and the in-flight deal rules, because redesigns fail in the handoff more often than in the math.
How to fill it in: the five passes
Pass one, build the universe. Export every account with firmographics. Completeness beats elegance: an account missing its segment will silently fall out of every downstream calculation.
Pass two, score opportunity. For each account, estimate realistic annual potential from your own history: what did lookalike accounts (same segment, size, industry) actually generate? Resist precision theater; a three-tier score (high, medium, low, with dollar anchors) derived from real win rates beats a false-precision model nobody can defend.
Pass three, draft the patches. Group accounts by your chosen model and equalize summed opportunity within each segment, then sanity-adjust for geography, language, and existing relationships. The target: every patch holds 3 to 5 times its quota in scored potential, because not everything closes.
Pass four, run the checks. The coverage tab should show zero unowned accounts, zero double-owned, and no patch below the threshold band. Any patch outside the band is a structural miss being assigned to a person, fix it now or explain it in the QBR later.
Pass five, link to quota and ship at a boundary. Derive each patch’s quota from its potential and the rep’s capacity, document the handoffs, and effect changes at quarter start, never mid-period. For the quota half of this math, see how to set quotas.
Assigning patches to people: the second half of fairness
Balanced patches assigned badly still fail, and the template’s owner column deserves as much thought as the scores. Three assignment rules earn their keep. Warm patches go to ramping reps: a new hire in a territory with existing relationships and active pipeline ramps months faster than one handed greenfield, so the assignment is itself a ramp investment; see what is sales ramp time for the curve math.
Greenfield goes to tenured reps who can fund the build time from an existing book. And relationship continuity gets weighed but not worshipped: keeping an account with its historical rep is worth something, but not worth carrying a 2x-potential patch next to a 5x one for another year.
Write the assignment rationale in the template, one line per patch, because the reps will ask, and a written reason beats a remembered one in every comp conversation that follows.
A worked example: the rebalance that fixed attainment
A hypothetical six-rep mid-market team runs equal-count territories: 250 accounts each, $700K quotas each, a design that looks fair in every meeting. Scored, the patches tell a different story: two coastal territories hold $4.0M and $3.8M of potential (5.7x and 5.4x quota) while two central patches hold $1.5M and $1.7M (2.1x and 2.4x, below the 3x floor).
The year plays out as scripted: coastal reps post 98% and 104% attainment, central reps post 54% and 59%, and the performance reviews blame the people.
The template’s rebalance: move two metro clusters and one vertical from the over-weighted coastal patches to the central ones, bringing all six territories to $2.7M to $3.1M of potential (3.9x to 4.4x quota). Transition rules: in-flight deals stay with the closing rep, moves land at Q1 start, every transferred account gets a documented handoff.
The next year’s attainment spread runs 71% to 89%, within normal performance variance, with the same six people. Territory design was the performance program; see what is sales territory planning for the full design discipline.
Choosing the territory model inside the template
The template supports four models, and the choice should follow how customers buy, not how the org chart looks. Geographic suits field motions where travel time is real. Vertical suits products whose story changes by industry.
Segment (SMB, mid-market, enterprise) is the default for scaling SaaS because cycle length, deal size, and ramp all differ by segment, which makes it the model that maps most cleanly onto capacity and quota math.
Named accounts suit enterprise motions, and live or die on the scoring quality from pass two. Most real designs blend: segment first, then geography or named lists within segment, and the template’s tabs are structured for exactly that nesting.
Template limitations, honestly
The template is a design tool, not an operating system. It is static: the moment a rep leaves, an account grows out of its segment, or a hiring class lands, the balance is stale until someone re-scores and re-checks by hand. It cannot watch the seams continuously, mid-year account growth quietly creates ownership disputes the coverage tab only catches at the next manual pass.
And it cannot price a proposed change: moving a vertical between patches changes quota math, coverage math, and capacity math, and the spreadsheet shows none of that until rebuilt. For an annual design cycle at one or two segments, those limits are tolerable; past that, they are the bottleneck.
From template to connected model
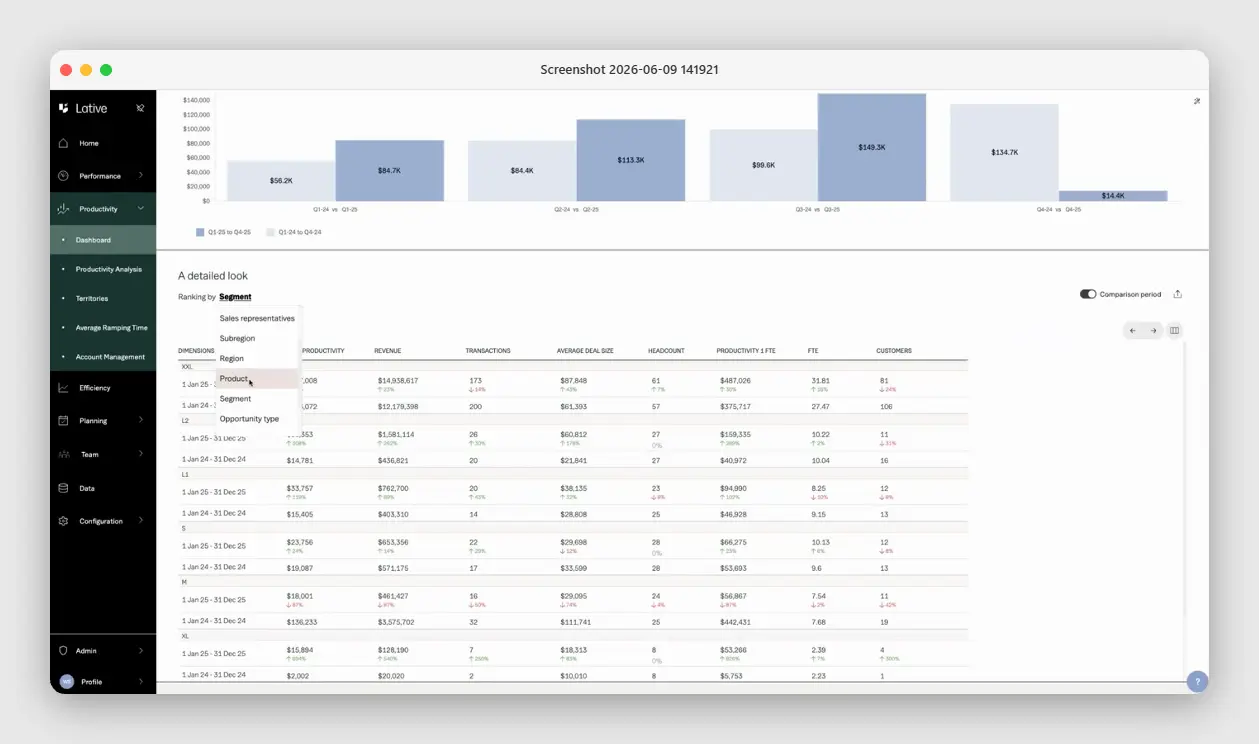
Territory, capacity, and quota are one system: the patch determines what is winnable, capacity determines what each rep can work, and quota should be derivable from both. Lative runs that system live.
The Productivity module shows what each region, segment, and product line has actually produced, so patches are scored against real output rather than estimates alone; the Capacity view checks each rep’s load against ramp-adjusted productive capacity; and because Quota Modeling and Annual Planning share the same model, a proposed territory change shows its quota and coverage impact immediately, before anyone signs a comp plan.
The template teaches the design discipline; the platform keeps the design true between annual cycles. The capacity math underneath is in how to calculate sales capacity.
Frequently asked
What should a sales territory plan template include?
An account universe with opportunity scores, territory definitions with summed potential per patch, coverage checks for gaps and overlaps, a quota linkage showing potential as a multiple of quota, and a transition tracker for redraws.
How do you score territory opportunity?
From your own history: realistic annual potential per account based on win rates and deal sizes for lookalike accounts in the same segment, size band, and industry. Three honest tiers beat false precision.
What makes a territory balanced?
Equalized winnable opportunity within segment, commonly 3 to 5 times quota in scored potential per patch, with zero unowned or double-owned accounts. Equal account counts are not balance.
How often should territories be redrawn?
Review annually, redraw when triggers fire: headcount changes over 15%, ICP shifts, or attainment variance above 40 points between same-segment reps for consecutive quarters.
How do you handle in-flight deals during a territory change?
They stay with the current owner through close, with a written split if the new owner contributes. Changes land at quarter boundaries with documented handoffs, never mid-period.
When does a territory spreadsheet stop being enough?
Past two segments or the first cohort hiring class, when continuous rebalancing and quota-impact pricing exceed what a manual re-score can keep current.
The deeper habit the template builds: territory stops being a once-a-year political negotiation and becomes a scored, auditable design, which changes every conversation downstream, quota, comp, and performance, because the foundation under them is finally a number instead of a map someone drew in a hurry.
Download the template, score on opportunity, balance within the band, and ship at a quarter boundary. For the connected version where territory, capacity, and quota stay true year-round, see the full sales capacity planning guide, or book a demo.