Give two reps the same quota but very different territories and one is set up to win while the other is set up to quit. Sales territory planning is how you make coverage fair, balanced, and actually winnable, and it is the most underrated input to every number the sales org reports, because territory quality silently caps what any rep can produce.
The attainment crisis makes the stakes concrete. The Bridge Group’s 2024 SaaS AE Metrics Report (n=419 SaaS companies) found only 51% of AEs hit quota in 2024, and a meaningful share of every miss cohort is carrying patches that never held enough opportunity to support the number.
This guide covers what sales territory planning is, the four territory models, how to design balanced territories step by step, a worked example, and the mistakes that turn territory design failures into attainment failures.
Sales territory planning, defined
Sales territory planning is the process of dividing your market into segments, territories, and assigning them to reps. A territory can be defined by geography, industry, account size, named accounts, or a mix. The aim is balanced coverage: every patch holds enough winnable opportunity to support its quota, no accounts fall between owners, and no rep carries an impossible or empty patch.
The definition hides the hard part: “balanced” means balanced on opportunity, not on account count. Fifty enterprise accounts and fifty SMB accounts are not the same territory, and treating them as equivalent is where most designs fail before the year starts.
Why territory planning matters
Bad territories are expensive in ways that surface too late to fix cheaply. Reps with thin patches miss quota through no fault of their own, conclude the system is rigged, and leave, taking their ramp investment with them. Reps with rich patches coast, and the company overpays commissions for revenue that the territory, not the rep, produced.
Coverage gaps starve good accounts of attention while overlaps burn selling time on ownership disputes. And every one of these failures shows up in the data disguised as something else: a performance problem, a comp problem, a motivation problem. Fix the patches and the same headcount produces more, with less churn and cleaner data.
The four territory models
- Geographic. Split by region or country. Simple, clean for field sales and time zones, and blind to opportunity density: a metro patch and a rural patch of equal area are wildly unequal territories.
- Industry or vertical. Reps specialize by sector and build real domain depth. Strong where the product story changes by industry; harder to balance because verticals differ in size and buying behavior.
- Account size or segment. SMB, mid-market, and enterprise teams with different motions, cycle lengths, and quotas. The default for scaling SaaS, and the model that maps most cleanly onto capacity math, because each segment carries its own conversion and ramp profile.
- Named accounts. A defined list of target accounts per rep, common in enterprise. Precise, but it lives or dies on the quality of the account scoring that built the list.
Most real designs blend models, segment first, then geography or named accounts within segment, and the blend should follow how customers actually buy, not how the org chart looks.
How to design territories: a five-step process
- Score the market. Build an account universe with firmographics, segment, and an opportunity score: realistic annual revenue potential per account based on historical win rates and deal sizes for lookalike accounts.
- Size the patches against quota. Each territory should hold winnable opportunity comfortably above its quota, a common heuristic is 3 to 5 times quota in scored potential, because not everything closes. A patch below that threshold is a structural miss assigned to a person.
- Balance on opportunity, then minimize disruption. Equalize scored potential across reps within a segment, then adjust for geography, language, and existing relationships. Every reassignment burns relationship equity, so move accounts only when the balance case is real.
- Check the seams. Every account has exactly one owner; rules of engagement cover splits, inbound routing, and what happens when an SMB account grows into mid-market mid-year.
- Connect to quota and capacity. Territory, quota, and capacity are one system: the patch determines what is winnable, the capacity model determines what the rep can work, and the quota should be derivable from both. Setting them in three separate meetings is how contradictions get built in.
A worked example
A hypothetical mid-market team of six carries $700K quotas each. The current geographic design gives the two coastal reps patches scoring $4.2M and $3.8M in winnable potential, while the two central reps hold patches scoring $1.4M and $1.6M, barely twice quota, against a 4x target threshold.
Twelve months later the results look like a talent story: coastal reps at 105% and 98% attainment, central reps at 52% and 61%. It is not a talent story. At realistic win rates, the central patches could not produce the number; the design assigned a miss and waited.
Rebalancing on scored opportunity, shifting two metro clusters and one vertical from coastal to central patches, brings every territory to $2.8M to $3.2M of potential. The following year, the same four reps land between 78% and 94% attainment. Nothing about the people changed. The patches did, and so did the truthfulness of every attainment number the org reports.
Balanced on account count
- Fifty enterprise and fifty SMB accounts treated as equal
- Thin patches assign a structural miss to a person
- Shows up as a talent, comp, or motivation problem
Balanced on scored opportunity
- Every patch holds 3–5x quota in winnable potential
- Each territory is structurally achievable before the year starts
- Attainment becomes a truthful signal, not a patch artifact
When to redraw territories
At minimum annually, as part of the planning cycle, and immediately when specific triggers fire: headcount changes more than 15% in a segment, a new product changes the ICP, two consecutive quarters where attainment variance across same-segment reps exceeds 40 points, or expansion revenue starts dominating a patch designed for new logos.
Mid-year redraws should be rule-based and compensated, ad hoc raids on a struggling rep’s best accounts destroy trust faster than any miss.
Handling territory transitions without losing deals
Redraws fail in the handoff more often than in the design. Three rules protect the pipeline: first, in-flight opportunities stay with the current owner through close, with a written split if the new owner does material work. Second, transitions land at quarter boundaries, never mid-quarter, so attainment math stays clean and nobody’s commission depends on an interpretation.
Third, every transferred account gets a documented handoff, relationship history, open threads, renewal dates, because the revenue cost of a silent transition is real even when no deal is technically lost. Budget four to six weeks of reduced productivity in heavily redrawn patches and put it in the capacity model, where it belongs, rather than discovering it in the attainment data later.
Common territory planning mistakes
Balancing on account count. Equal counts of unequal accounts is the original sin of territory design. Score opportunity first.
Designing territories after hiring. If patches get carved to fit whoever was hired, capacity never enters the math. Design the territory map from the market, then staff it.
Ignoring ramp in assignments. Handing the hardest greenfield patch to the newest rep maximizes ramp time precisely where the company can least afford it. Warm patches shorten ramp; greenfield belongs with tenured reps who can afford the build time.
Set-and-forget. Markets shift, segments grow, reps leave. A territory map that holds for eighteen months is describing a company that no longer exists.
No seam rules. Unowned accounts get no attention; double-owned accounts get disputes. Both are pure waste, and both are design choices.
How Lative connects territory to capacity and quota
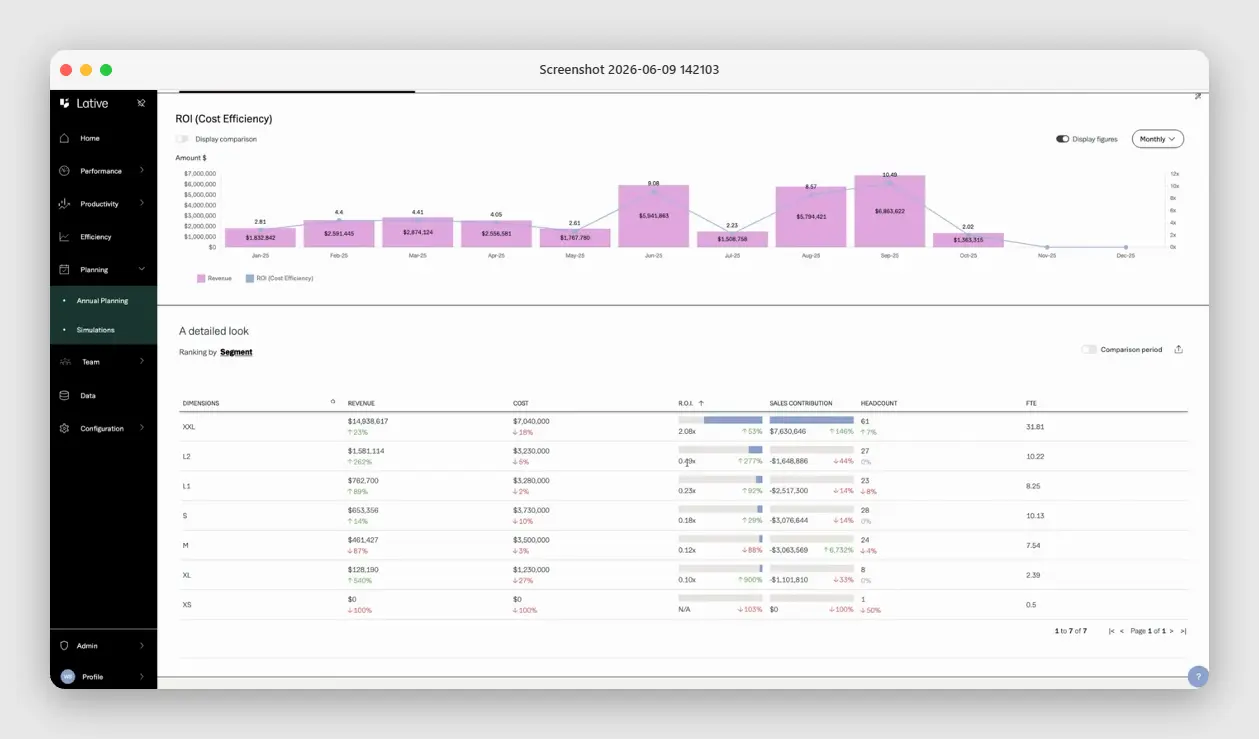
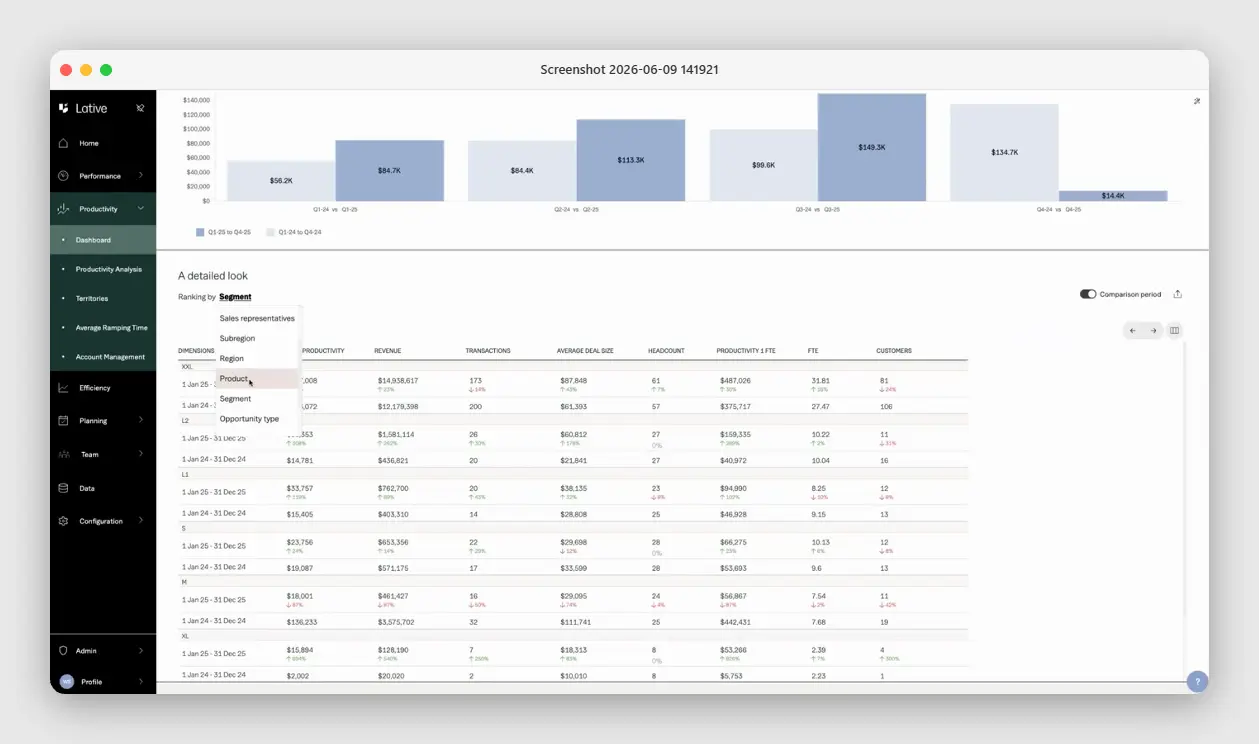
Most territory tools optimize the map. Lative connects the map to the math. The Productivity module breaks production out by region, segment, product line, and opportunity type, so you can see what each patch has actually produced, not just what it theoretically holds, and territory balance gets checked against real output.
The Capacity view shows productive capacity per rep and team, so a proposed design is tested against whether each rep can actually cover the patch.
And because Quota Modeling and Annual Planning run on the same model, a territory change flows through to quota and capacity instantly: change the patches and you see what it does to the number before anyone signs a comp plan. Territory, capacity, and quota planned as one system, which is what they are.
Key takeaways
- Balance territories on winnable opportunity, not account count; equal counts of unequal accounts is the original sin.
- Each patch should hold roughly 3–5x quota in scored potential, or it is a miss assigned to a person.
- Territory, capacity, and quota are one system; planning them in three meetings builds in contradictions.
- Give greenfield to tenured reps and warm patches to new hires, so territory design does not inflate ramp.
Frequently asked
What is sales territory planning?
The process of dividing a market into territories, by geography, industry, segment, or named accounts, and assigning them to reps so that coverage is balanced on real opportunity and every quota is structurally achievable.
Who owns sales territory planning?
Usually RevOps or sales ops with sales leadership, since it sits between strategy and execution. Finance validates the link to quota and comp.
How often should territories change?
Review annually at minimum, and redraw when triggers fire: major headcount changes, ICP shifts, or persistent attainment variance across same-segment reps.
What makes a territory fair?
Balanced winnable opportunity, commonly 3 to 5 times quota in scored potential, with clean ownership rules. Account-count equality is not fairness.
What is the best territory model?
For scaling SaaS, segment-first (SMB, mid-market, enterprise) with geographic or named-account splits inside each segment, because it maps directly onto capacity and quota math.
How does territory planning connect to capacity planning?
The territory sets what is winnable; the capacity model sets what the rep can work; the quota should be derivable from both. Planning them separately builds contradictions into the year.
Good territory planning is quiet: nobody notices it until it is wrong. Build it on scored opportunity, tie it to capacity, and it stays right longer. See the full sales capacity planning guide, or book a demo to see territory, capacity, and quota planned as one model.