Hire a rep today and they will not pay for themselves for months. Sales ramp time is the lag between a start date and full productivity, and it is one of the most expensive numbers in sales that most teams never measure. Every unmeasured ramp assumption flows straight into the capacity plan, the forecast, and the comp plan, and it is usually wrong in the optimistic direction.
This is the definitional guide: what ramp time is, the three ways to calculate it, what typical benchmarks look like, how ramp drives planning decisions, and the mistakes that make it longer than it needs to be. For 2026 benchmarks by segment and the four levers that compress ramp, the companion deep dive is sales ramp time: benchmarks and levers.

Sales ramp time, defined
Sales ramp time is how long it takes a new sales rep to reach full productivity, usually defined as consistently producing at or near the level of a tenured peer, commonly 80% or more of full quota across consecutive months. The clock starts on day one and ends when the rep performs like the team average, not at their first closed deal.
It matters because ramp is dead weight in the capacity plan. A rep in month two is on full payroll while producing a fraction of a full load. Ignore that and every downstream number, capacity, coverage, forecast, runs too optimistic.
Gong’s 2025 onboarding research found the path to full productivity is measurable and repeatable, but only for organizations that actually track what new reps do in the first 30 to 90 days rather than waiting to see whether month-six attainment shows up.
Three ways to calculate ramp time
- Time to full quota (recommended). Months from start date until the rep sustains a defined share of full quota, typically 80%+, across consecutive months. This is the number the capacity model needs, because it measures durable production, not a lucky deal.
- Time to first deal. Months from start date to first closed-won. Easy to measure and dangerously noisy: it depends on deal size, territory warmth, and timing luck. A rep who closes a small deal in month two and then nothing until month seven did not ramp in month two. Treat it as a milestone, never as the ramp metric.
- Sales-cycle method. Average sales cycle for the segment plus a prospecting-and-onboarding buffer. A useful first estimate before cohort data exists: an enterprise motion with a nine-month cycle cannot produce full-quota reps in six months, whatever the onboarding deck says.
Whichever method you use, calculate it by cohort and segment, never as one company-wide average. The blended number hides exactly the divergence that breaks plans.
Building the ramp curve
A single ramp number is the summary; the curve is the planning tool. Map expected productivity by month from cohort actuals, for example 0% in month one, 25% by month three, 75% by month six, 100% by month nine for a mid-market motion.
Two properties matter. First, curves are S-shaped, not linear: months one through three produce little closed revenue because pipeline is still building, then production jumps between months four and seven.
Second, curves differ by segment: SMB reps often reach 80% of quota in three to four months on sub-45-day cycles, mid-market typically takes five to seven months, and true enterprise reps, $150K+ deals and multi-stakeholder cycles, realistically take nine to twelve months, sometimes modeled at eighteen.
The curve is what you load into the sales capacity model so each unramped rep contributes their month-appropriate fraction rather than a flat 50%.
A worked example
A hypothetical team hires six mid-market reps on January 2, each with an $800K annual quota, on a validated curve of 0% (month one), 25% (month three), 60% (month five), 100% (month nine).
The optimistic plan, reps at full productivity from day one, books $4.8M of new capacity for the year. The curve says otherwise: integrated across the year, each rep delivers roughly 55 to 60% of a full year, about $2.8M of real new capacity for the cohort.
The $2M difference is not a performance gap. It is a modeling error, and a completely predictable one. Plans that miss this discover it as a Q3 pipeline panic; plans that model it hire earlier or set targets honestly.
Why ramp time drives planning decisions
- Capacity planning. Ramp determines how much of a new hire’s quota actually lands in-year, which sets how many hires a growth target really requires and when they must start. A rep hired after Q1 in an enterprise motion contributes almost nothing to the current fiscal year.
- Forecasting. Forecasts that ignore ramp systematically overstate the back half. With attainment already averaging 51% across SaaS per The Bridge Group’s 2024 SaaS AE Metrics Report (n=419), an optimistic ramp assumption stacks error on error.
- Quota and comp. Ramped quotas that step up with the curve keep new hires engaged and keep the attainment data clean. Flat quotas from day one teach reps the number is decorative. See how to set quotas for SaaS reps.
- Hiring economics. Fully loaded cost starts on day one; production arrives months later. Ramp length is the payback-period variable, which is why a few weeks of compression across a hiring class is worth real money.
How to shorten ramp time
Four levers reliably compress the curve, and none of them is generic training. Territory quality first: a rep handed 200 qualified accounts with a proven motion ramps months faster than one handed leftovers. ICP clarity second: reps who can mechanically rank 50 accounts by likelihood to close skip the 60 days of trial-and-error learning.
Manager attention third: ramp-stage reps need closer to a 1:4 or 1:5 manager ratio than the 1:8 that works for tenured reps. And real data access fourth: Gong’s research found reps trained on actual account data in week one show materially higher early productivity than reps trained on synthetic scenarios. Measure by cohort so you can see which interventions actually moved the curve.
Ramp time and attrition: the compounding cost
Ramp and attrition multiply each other, which is why both belong in the same model. First-year rep attrition at many B2B SaaS companies runs 20 to 25%, and a rep who leaves in month eight of a nine-month enterprise ramp departs having produced almost nothing while costing a full year of salary, recruiting fees, and manager time. The replacement then restarts the clock.
A team of twelve with 25% first-year attrition and a six-month ramp is effectively running ten and a half productive seats, and the capacity model should say so explicitly. This is also the strongest business case for ramp compression: shortening ramp does not just pull revenue forward, it shrinks the window in which attrition destroys an entire hiring investment.
Common ramp mistakes
Measuring time to first deal. It rewards luck and small deals and tells you nothing about durable production.
Using one company-wide ramp number. SMB and enterprise curves differ by six months or more; the blend misplans both.
Carrying last cycle’s assumption forward. New ICP, new territory design, or a new product changes the curve. Re-derive it from the most recent two cohorts, not from the year the assumption was first written down.
Not separating ramp data from performance data. Cohort tracking calibrates the model; individual tracking manages people. Mixing them produces an average that serves neither purpose.
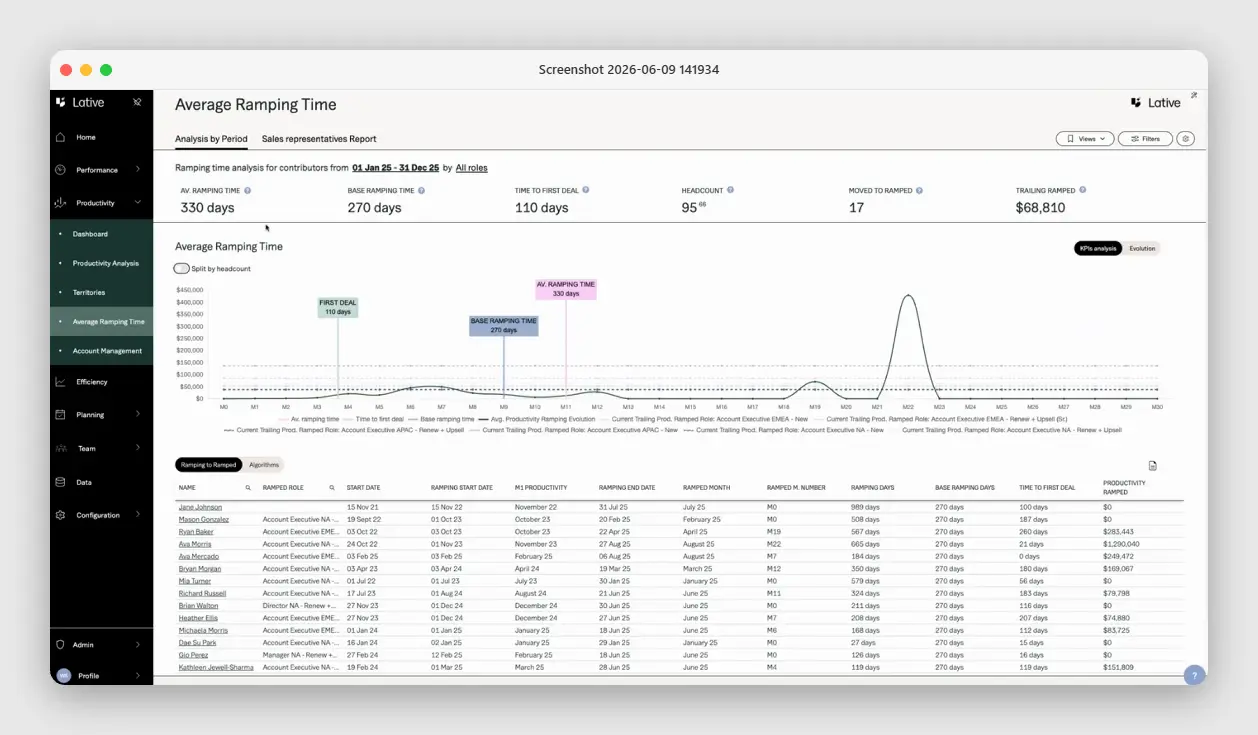
How Lative measures ramp
Lative has a dedicated Average Ramping Time view that computes days to full or average productivity, time to first deal, and the ramp of every individual rep, derived from your actual hire cohorts rather than a flat assumption.
Those curves feed the Capacity view directly, so each unramped rep contributes their month-appropriate fraction to productive capacity, and the Annual Planning view shows what hiring timing does to the year. When a cohort starts running behind the curve, the capacity impact surfaces in the current quarter, while there are still options, instead of in the QBR where the miss is already locked in.
Key takeaways
- Ramp time is the lag from start date to sustained full-quota production, not time to first deal.
- Curves are S-shaped and differ by segment; load the month-by-month curve into the capacity model, not a flat 50%.
- Ramp and attrition multiply: a 12-rep team at 25% first-year churn and a six-month ramp runs ~10.5 productive seats.
- Compressing ramp pulls revenue forward and shrinks the window where attrition destroys a hire’s whole investment.
Frequently asked
What is sales ramp time?
The time it takes a new sales rep to reach full productivity, usually measured from start date until they sustain roughly 80% or more of full quota across consecutive months.
What is a good sales ramp time?
It tracks the sales cycle: roughly three to four months for SMB, five to seven for mid-market, nine to twelve or more for enterprise. Benchmark against your own cohorts before comparing to anyone else’s.
How do you calculate ramp time?
Preferably as time to full quota: months from start date until a cohort sustains the productivity threshold. Build a month-by-month curve from cohort actuals and load it into the capacity model.
Why does ramp time matter for forecasting?
A ramping rep cannot carry a full load, so forecasts that ignore ramp overstate what the team will deliver, especially in the back half of the year.
How do you reduce sales ramp time?
Territory quality, ICP clarity, manager-to-rep ratios near 1:4 during ramp, and training on real account data, measured by cohort so you know what worked.
Is time to first deal the same as ramp time?
No. First deal is a noisy milestone. Ramp time measures durable production at or near full quota, which is what capacity and comp decisions depend on.
Ramp is a cost you can manage, but only if you measure it. See the full sales capacity planning guide, or book a demo to see your own cohorts’ ramp curves derived automatically.