Two reps with the same quota and very different territories are not running the same race, and no amount of coaching fixes a patch that never held enough opportunity.
Territory design failures surface in the attainment data disguised as performance problems: The Bridge Group’s 2024 SaaS AE Metrics Report (n=419 SaaS companies) found only 51% of AEs hit quota in 2024, and a meaningful slice of every miss cohort is working territories that were carved on geography or account counts instead of winnable opportunity.
Sales territory planning software is how you design balanced, winnable patches and keep them fair as the team grows. The market splits between mapping tools that optimize geography and planning tools that connect territory to capacity and quota. Here are the 12 worth knowing in 2026.
How we evaluated
Four criteria sort the category. Opportunity scoring: does the tool balance on real winnable potential, or on account counts and map shapes? Connection to quota and capacity: when territories change, do quotas and coverage math update, or does someone reconcile three files?
Seam handling: does it surface gaps, overlaps, and ownership conflicts before reps find them? And refresh cost: can you rebalance quarterly without a consulting engagement?
The 12 best sales territory planning tools in 2026
1. Salesforce Maps
Geographic territory design and routing native to Salesforce. The default for field-sales teams already on the platform: visualize, carve, and route without an integration project. Its lens is geographic; opportunity-based balance is on you.
2. Fullcast
Go-to-market planning that treats territory as ongoing policy rather than an annual map: rules, routing, and changes that flow through to the CRM continuously. Strong for SaaS teams whose territories are segments and account lists rather than postcodes.
3. Anaplan
Enterprise planning that models territory alongside quota and capacity at scale. The depth is there for large orgs with a planning team; the build-and-maintain cost is the trade.
4. Varicent
Territory and quota planning with deep sales performance management roots. A fit for larger orgs that want territory, quota, and comp administered in one suite.
5. Xactly AlignStar
Dedicated territory design and optimization, often paired with Xactly’s comp products. Purpose-built carving and balancing for orgs that take territory seriously as a discipline.
6. eSpatial
Mapping and territory software for visualizing and balancing geographic coverage. Lighter than the enterprise suites, useful where geography genuinely drives the motion.
7. Badger Maps
Route and territory planning aimed at field reps who sell in person: daily routing, check-ins, and patch coverage. A rep tool first, a planning tool second.
8. Maptive
Browser-based mapping for territory design and visualization. Quick to stand up for straightforward geographic carving.
9. Geopointe
Salesforce-native geolocation and mapping, bringing territory visualization inside the system of record.
10. Salesforce Sales Planning
Native quota and territory planning inside Salesforce. Convenient for annual carving; lighter than specialists on opportunity scoring and continuous rebalancing.
11. Pigment
Flexible planning models that can include territory as part of broader GTM planning. Like all platform-first tools, the territory logic is yours to build.
12. Lative
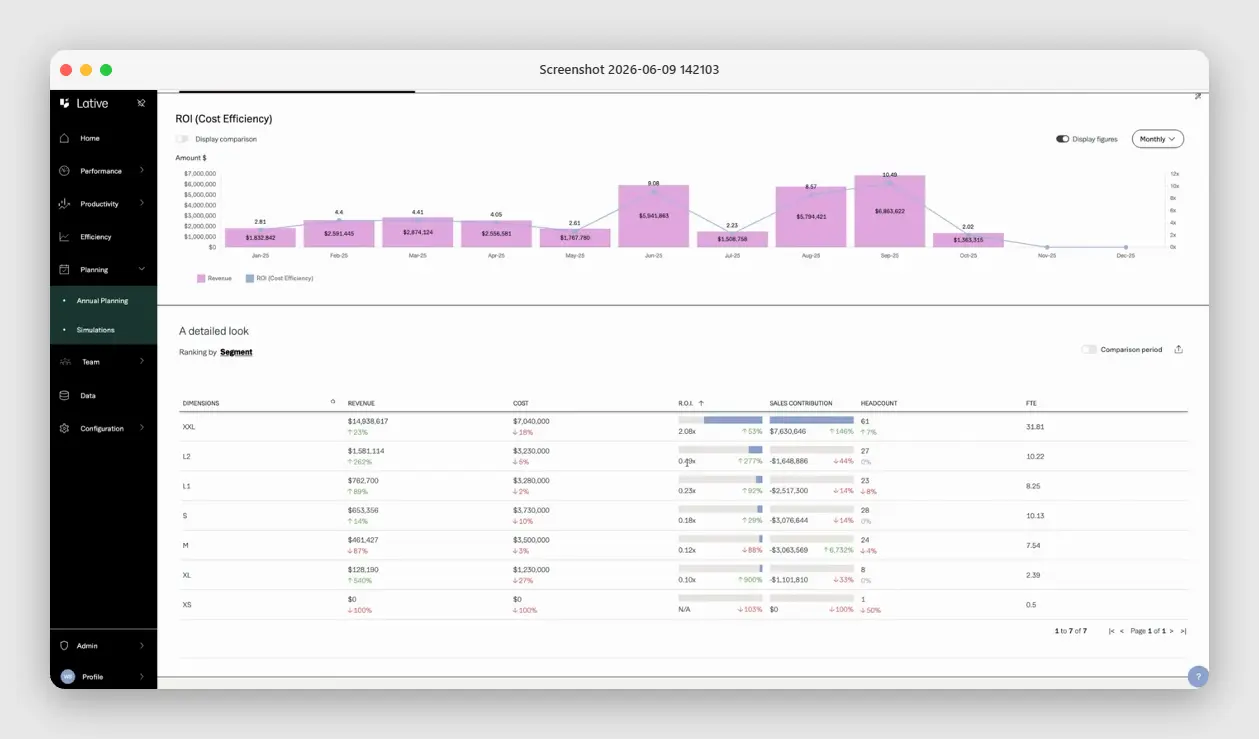
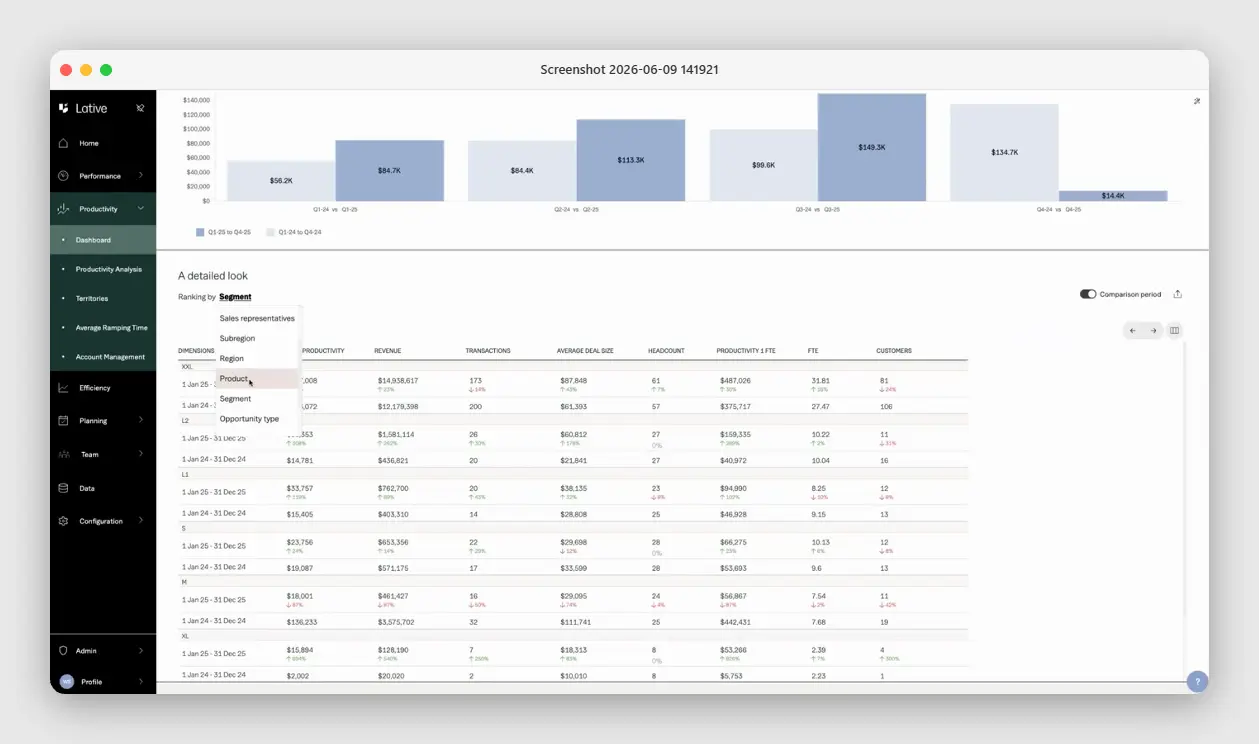
Most territory tools optimize the map. Lative connects the map to the math. Its Productivity module breaks production out by region, segment, product line, and opportunity type, so a proposed patch is checked against what that slice of the market has actually produced, not just what it theoretically holds.
The Capacity view tests the design against whether each rep can realistically cover the patch, and because Quota Modeling and Annual Planning run on the same model, a territory change flows through to quota and coverage instantly. It is not a geographic mapping tool; it is the layer that makes territory, capacity, and quota one decision instead of three meetings.
How to pick
- Field sales, geography-driven. Salesforce Maps, eSpatial, Badger Maps, or Geopointe: routing and map balance are the actual job.
- SaaS, segment and account-driven. Fullcast for territory-as-policy, Anaplan or Varicent at enterprise scale, Lative when territory should be planned together with capacity and quota.
- Territory tied to targets. Lative, so coverage and quotas are designed from the same model and a patch change shows its revenue impact before anyone signs a comp plan.
A worked example: the map looked fair
A hypothetical six-rep mid-market team splits the country into six equal-population regions, clean map, equal account counts, identical $700K quotas.
Score the patches on winnable opportunity, historical win rates and deal sizes for lookalike accounts, and the fairness evaporates: two coastal patches hold $3.9M and $4.1M of scored potential while two central patches hold $1.5M and $1.7M, barely twice quota against a healthy 3 to 5x threshold.
Twelve months later the predictable result reads like a talent gap: coastal reps above 95% attainment, central reps near 55%. Rebalancing on scored opportunity, moving two metro clusters and a vertical, brings every patch to roughly $2.9M and the next year’s attainment spread inside 16 points.
Nothing about the people changed. The software question is simply which tool would have shown you the imbalance in January: a mapping tool renders the equal regions beautifully; an opportunity-scored planning layer flags the 2.6x potential gap before quotas ship.
Implementation: from purchase to balanced patches in six weeks
The rollout that works runs in three passes. Weeks one and two: build the account universe and score it, firmographics, segment, and realistic annual potential per account derived from historical win rates and deal sizes on lookalike accounts.
This is the slow, valuable part; the tool renders whatever scoring you feed it. Weeks three and four: draft the design, equalize scored potential within segments, run the capacity check per rep, and pressure-test the seams (every account one owner, growth-path rules written).
Weeks five and six: socialize with the reps who live in the patches, adjust for relationship reality, and ship at a quarter boundary with documented handoffs. Skipping the scoring pass to get to the pretty map faster is the single most common implementation failure, because it automates the account-count fallacy at higher resolution.
Common buying mistakes
Buying a map for a math problem. If your territories are segments and named accounts, geographic optimization is the wrong axis entirely. Score opportunity first; see what is sales territory planning for the design process.
Designing territories disconnected from quota. A tool that carves patches but cannot show the quota and coverage impact produces beautiful maps and contradictory targets.
Annual-only rebalancing. Markets shift and reps leave mid-year. If rebalancing requires a project, it will not happen, and the design decays. Quarterly review with rule-based triggers is the standard worth buying for.
Ignoring transition cost. Every reassignment burns relationship equity and four to six weeks of productivity. The planning layer should model that cost, and the rollout should land at quarter boundaries with written handoffs.
Signals your current territory design is failing
Four flags, any two of which justify a redesign: attainment variance above 40 points between same-segment reps across consecutive quarters; new-hire ramp consistently slower in specific patches (thin territory masquerading as slow learning); accounts going untouched for two quarters because they fall between owners; and quota negotiations that relitigate the map every cycle because nobody trusts the balance.
Each flag is measurable from CRM data you already have, which makes the case for redesign an arithmetic exercise rather than a political one.
Frequently asked
What is sales territory planning software?
Software for dividing a market into balanced territories and assigning them to reps, ranging from geographic mapping tools to planning platforms that connect territory to capacity, quota, and coverage math.
What is the difference between mapping and territory planning tools?
Mapping tools optimize geography: routes, regions, visual balance. Planning tools optimize outcomes: scored opportunity per patch, quota achievability, and capacity match. Field teams need the first; SaaS teams mostly need the second.
How do you balance territories fairly?
Score every account on winnable potential, then equalize scored opportunity per rep within segment, targeting 3 to 5 times quota in potential per patch. Account-count equality is not fairness.
How often should territories be rebalanced?
Review annually at minimum, with rule-based triggers in between: headcount changes over 15%, ICP shifts, or persistent attainment variance over 40 points between same-segment reps.
How does territory planning connect to capacity planning?
The territory sets what is winnable; the capacity model sets what each rep can work; the quota should be derivable from both. Tools that hold all three in one model prevent the contradictions annual planning bakes in.
A closing calibration on category fit: the mapping tools and the planning tools on this list are not competitors, they are different jobs that happen to share a word. If your reps drive to customers, buy a map and route well.
If your reps sell into segments from a desk, the map is decoration and the math, scored opportunity, capacity match, quota derivation, is the entire game. Most buying disappointment in this category comes from purchasing the other job’s tool.
Balance territories on opportunity, not account count, and tie the design to capacity so it holds up against the number. See the full sales capacity planning guide, or book a demo to see territory, capacity, and quota planned as one model.