A sales capacity plan answers the question every revenue target depends on: do you have enough productive selling capacity to hit the number. Most teams find out the honest answer in Q3, when the gap is no longer fixable.
The data says this is the norm, not the exception: RepVue’s Q2 2025 Cloud Sales Index of roughly 47,000 reps across 246 companies found 57.31% of SaaS reps missed quota, with average attainment at 42.69%. Numbers like that are what plans built backward from a board target produce.
This guide is the practical build: six steps, the exact data each one needs, decision rules, and a worked example threaded all the way through. For the strategic framework around the plan, the cross-functional meetings and operating cadence, see the capacity planning framework guide. This post is the hands-on version you can execute this week.
Before you start: the data you need
Gather four things. All of them already exist in your CRM and HR system:
- Rep roster with start dates and segments. Every quota-carrying rep, when they started, and which segment they sell into.
- Trailing attainment for ramped reps. The last four quarters of attainment for reps past ramp, kept separate by segment. Do not blend SMB and enterprise; they attain differently and the blend describes neither.
- Cohort ramp history. What your last two or three hiring classes actually produced in months one through nine. If you have never measured it, Gong’s 2025 onboarding research found ramp is measurable and repeatable once tracked, and your CRM has the history.
- Attrition by tenure band. First-year attrition at many B2B SaaS companies runs 20 to 25%. Pull your own number; it changes the back half of every plan.
The worked example below uses a hypothetical Series B company, Meridian Software: $3M quarterly target, eight quota-carrying reps, two segments.
Step 1: Define productive capacity per ramped rep
For each fully ramped rep, productive capacity = quota x trailing attainment. Do not use quota alone. A rep carrying $1.2M at 65% trailing attainment is a $780K rep in the plan, and pretending otherwise just relocates the miss to Q4.
Meridian: five ramped mid-market reps carry $300K quarterly quotas at 70% trailing attainment, so $210K each. One ramped enterprise rep carries $500K at 55%, so $275K.
Step 2: Build the ramp curve from cohort actuals
Map expected productivity by month from what past cohorts actually did, not from the onboarding deck. A typical mid-market curve looks like 0% in month one, 25% by month three, 75% by month six, 100% by month nine; enterprise curves run longer because a rep cannot close a nine-month cycle in month four.
Apply the curve to every unramped rep based on their start date. For benchmarks by segment and the levers that compress ramp, see sales ramp time.
Meridian: two mid-market reps hired last quarter sit at month four of a six-month ramp, contributing roughly 40% of a full load, so $84K each this quarter.
Step 3: Calculate each rep’s contribution and sum it
Multiply each rep’s full productive capacity by their ramp position, then sum the team. This is your bottom-up capacity number, and it is almost always lower than the roster suggests.
Meridian: five ramped mid-market reps at $210K each ($1.05M), one ramped enterprise rep at $275K, two ramping mid-market reps at $84K each ($168K), and a second enterprise hire starting week one of the quarter who contributes approximately nothing this period. Total bottom-up capacity: roughly $1.49M against a $3M target.

Step 4: Compare capacity to the target and size the gap
Put the bottom-up number next to the target. The gap is a fact, not a negotiating position. State it in dollars and in time: how big is it, and how many months do you have before it becomes unfixable this fiscal year?
Meridian’s gap is $1.51M for the quarter, just over 50% of target. Found in week one of the quarter, that is survivable through pipeline mix, quota redistribution, and pulled-forward hiring. Found in month two of three, it is a miss.
Step 5: Close the gap with named levers and owners
A capacity gap has exactly four levers, and each has a different cost and time horizon:
- Hire more reps. Slowest lever. A rep hired today at a six-month ramp contributes almost nothing this fiscal half. Reps Needed = Gap / (Quota x Expected Attainment), then adjust upward for ramp timing.
- Improve productivity per rep. Ramp compression, territory fixes, and better pipeline quality. A two-week ramp improvement across a six-rep cohort is real capacity with no new payroll.
- Raise pipeline volume or conversion. If capacity exists but pipeline is thin, the constraint is demand, not headcount. Check pipeline coverage by segment before requesting heads.
- Reset the target. The lever nobody wants, and sometimes the honest one. A target with no credible path is not ambition, it is deferred blame.
Every lever gets a named owner and a date. Unowned levers do not close gaps.
Step 6: Set quotas from capacity, then keep the plan alive
Assign quotas based on each rep’s realistic, ramp-adjusted capacity, not the target divided by headcount. This single change is the difference between a plan reps can hit and one they write off in February. Then re-run the model monthly: every hire that slips, every resignation, every conversion shift changes the number.
An annual capacity plan is stale by Q2; a monthly one catches the drift while you still have options. For the underlying math, see how to calculate sales capacity.
The monthly capacity review: a 30-minute agenda
The plan stays alive through a short, fixed-agenda review. Fifteen minutes on inputs: did any hires slip, did anyone resign or go on leave, did any segment’s trailing attainment move more than two points? Ten minutes on the output: what is the new bottom-up capacity number, and how did the gap against target change since last month? Five minutes on decisions: which lever moves, who owns it, and by when.
Attendees are RevOps, the CRO or VP of Sales, and a finance partner, the same three roles that otherwise discover the gap separately in three different documents. Flag every input change as green, yellow, or red; yellow and red items leave the meeting with an owner and a date.
Teams that run this cadence find capacity problems six to nine months before they become revenue misses, which is the entire difference between a plan correction and a bad quarter.
Common mistakes that break the plan
Counting heads instead of capacity. Dividing the target by headcount skips attainment and ramp entirely. It is the most common method and the least accurate. The Bridge Group’s 2024 SaaS AE Metrics Report (n=419) found average attainment of 51%; plans that assume 100% are wrong by construction.
Flat ramp assumptions. Modeling every new hire at 50% from day one overstates early-quarter capacity and understates late-quarter capacity. Ramp curves are S-shaped; use cohort actuals.
One blended segment. A blended attainment rate across SMB and enterprise produces a plan that is wrong in both directions at once: overstaffed where deals are small, undercovered where they are large.
Set-and-forget planning. The plan that gets built in October and reviewed next October is a historical document. The teams that hit their numbers re-run it monthly and treat changes as signals, not annoyances.
How Lative runs this as a live system
Everything above can be built in a spreadsheet once. Keeping it current is the part that fails.
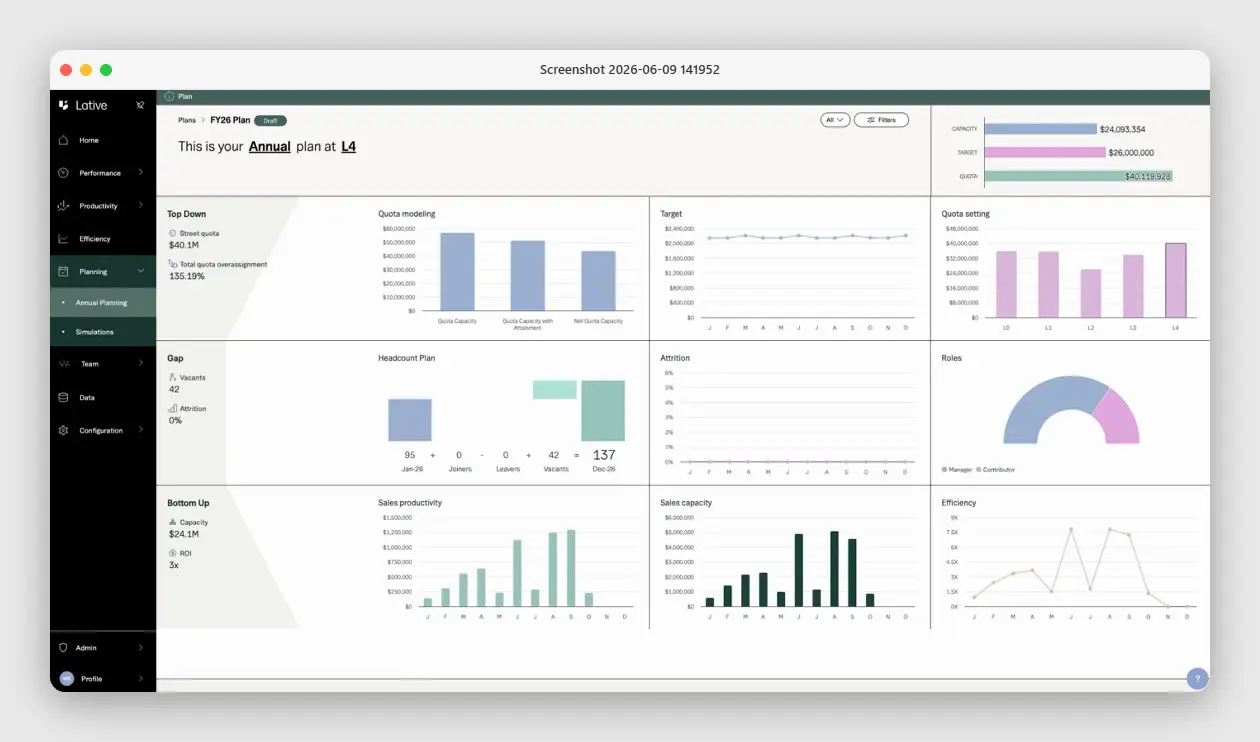
Lative runs the same six steps as a live model: the Productivity module computes per-rep production from closed-won data by segment, Average Ramping Time derives ramp curves from your actual hire cohorts, the Capacity view sums ramp-adjusted contribution per rep and team, and Annual Planning holds that bottom-up number against the top-down target and quota on one screen, with hiring, attrition, and roles modeled in the gap.
When a hire slips or a rep resigns, the gap recalculates immediately instead of at the next planning cycle, and the Simulations view shows what each gap-closing lever is actually worth before you commit to it.
FAQ
What is a sales capacity plan?
A model of how much revenue your sales team can realistically produce, based on rep capacity, ramp, and attrition, compared against your target, with named levers to close any gap.
How often should you update a capacity plan?
Monthly at minimum. Hiring delays, attrition, and conversion shifts change the number throughout the year, and gaps found early are gaps you can still close.
What is the hardest part of capacity planning?
Ramp. Most teams overstate capacity by treating new hires as productive too early. Build ramp curves from cohort actuals, not assumptions.
Who should own the capacity plan?
RevOps builds and maintains it; the CRO owns the number; finance validates the assumptions. The plan fails when all three keep separate copies.
How is a capacity plan different from a sales forecast?
The forecast predicts what will close this period from live pipeline. The capacity plan defines what the team can structurally produce. A forecast above capacity is a warning, not good news.
Build the plan from capacity up and the rest of your planning has a foundation. See the full sales capacity planning guide, or book a demo to see your roster as a live capacity plan.