Every sales team manages performance. Most do it with a patchwork of spreadsheets, a comp plan nobody fully understands, and a quarterly scramble to figure out who is on track. Sales performance management, SPM, is the discipline of doing it on purpose: connecting targets, territories, quotas, compensation, and measurement into one system where a change in any part flows through the rest.
The cost of the patchwork approach shows up in the attainment data. The Bridge Group’s 2024 SaaS AE Metrics Report (n=419 SaaS companies) found average AE attainment of 51% in 2024, down from 66% in 2022, and RepVue’s Q2 2025 Cloud Sales Index put the miss rate at 57.31% across roughly 47,000 reps.
When most of a sales population misses its number, the targets, territories, and comp plans were built disconnected from capacity. This guide covers what SPM is, its five components, how the pieces interact, where most implementations fail, and how to build the planning side that makes the rest credible.
Sales performance management, defined
Sales performance management is the set of processes and tools used to plan, manage, and improve how a sales team performs. It spans how you set targets, design territories, assign quotas, run incentive compensation, and measure results, treated as one connected system rather than five disconnected annual exercises.
The operative word is connected. Change the revenue target and the quotas, territories, comp cost, and hiring plan all change with it. In a working SPM system you can see those downstream effects before you commit; in a patchwork, you discover them quarter by quarter.
The five components of SPM
- Territory management. Dividing the market into balanced, winnable patches based on real opportunity, not account counts. A rep in a territory holding $800K of winnable pipeline cannot hit a $1.2M quota regardless of skill, and the SPM system should make that visible before assignment, not after the miss. See what is sales territory planning.
- Quota management. Setting sales quotas that are ambitious, achievable, and derived from capacity: trailing attainment, ramp position, and territory potential, not the board target divided by headcount.
- Incentive compensation. The comp plans that pay against those quotas: base-variable splits, accelerators, SPIFs, and the administration that makes payouts accurate and on time. Comp disputes are the fastest way to lose a good rep, and most disputes trace to ambiguity the SPM system should have removed.
- Capacity and headcount planning. Ensuring there are enough productive, ramped reps to carry the total quota. This is the load-bearing component: every other piece assumes the roster can produce the number, and that assumption is exactly what a capacity model tests.
- Analytics and measurement. Attainment and its distribution, ramp progress, territory health, comp cost of sales, and the trend lines that show whether the system is improving.
How the components interact: one worked pass
Walk one hypothetical planning cycle through the system. The board sets $12M for next year. Capacity planning says the current roster, ramp-adjusted, produces $9.8M, so the system surfaces a $2.2M gap and the options: three Q1 hires (at a six-month ramp, contributing roughly $900K in-year), a ramp-compression program, or a target conversation.
Leadership picks hires plus ramp work. Territory management then carves patches so the new heads have real opportunity without cannibalizing tenured reps.
Quota management distributes $13.4M of quota (12% over-assignment against realistic attainment) with ramped quotas for the new cohort. Comp builds plans against those quotas with accelerators above 100%.
Analytics tracks attainment distribution monthly, and when the January cohort ramps four weeks slow, the capacity model flags the in-year impact and the system adjusts before Q3. Every component touched every other component. That interdependence is SPM; the version where five spreadsheets do this separately is just hope with extra steps.
Five disconnected spreadsheets
- Territory, quota, comp, capacity, and analytics in separate files
- A change in one never flows to the others
- You discover the downstream effects quarter by quarter
One connected SPM system
- Change the target and quotas, territories, and comp move with it
- See the downstream effects before you commit
- One planning input, signed off across sales, RevOps, and finance
Why the planning side is where SPM breaks
Most SPM failures are not comp failures; comp tools are mature. They are planning failures: quotas set top-down with no capacity check, territories carved by geography instead of opportunity, ramp treated as a flat assumption. The result is the familiar pattern, attainment below 50%, comp disputes, quiet territory resentment, and a performance-management process busily managing people who were set up to miss.
Fixing the planning inputs fixes most of what gets blamed on execution. The payoff for getting the operating system right is large: the Ebsta x Pavilion 2024 analysis of 4.2 million opportunities found RevOps-driven teams achieved 87% higher win rates and 21% shorter cycles than peers.
SPM vs CRM vs sales enablement
A CRM records what is happening in deals: contacts, stages, activities. SPM decides how the team is structured, targeted, and paid to make those deals happen, and most SPM tooling sits on top of the CRM rather than replacing it.
Sales enablement, meanwhile, owns rep skills, content, and training. The clean division: enablement makes reps better, SPM makes the system around them fair and achievable, the CRM records the results. Companies that conflate them end up coaching reps out of problems that quota design created.
Designing the comp plan inside the system
Because comp is where SPM touches every rep’s paycheck, two design rules earn their keep. First, simplicity beats precision: a rep should be able to compute their own commission on a napkin. Plans with more than three or four variables stop driving behavior because nobody can connect today’s action to the payout.
Second, watch for threshold artifacts in your own data: when attainment clusters at 78 to 85%, just below an accelerator, you are looking at comp design shaping behavior, not capacity, and feeding that clustered number back into next year’s quota model bakes the distortion in permanently.
The SPM analytics layer exists partly to separate these effects: capacity explains what the team could do, comp design explains why the distribution bunches where it does, and conflating them ruins both the comp plan and the capacity model.
The quarterly SPM health check
One practical habit keeps the whole system honest: a quarterly thirty-minute health check across four questions. Is the attainment distribution healthy, 60 to 80% of ramped reps at quota, or is the number being carried by two stars? Are any territories persistently under 50% attainment across multiple owners, which indicts the patch rather than the people?
Is comp cost of sales tracking to plan, or are accelerators paying out faster than the bookings justify? And has anything changed, product, pricing, segment mix, that invalidates a planning assumption made in January? Each red flag routes to a specific component owner with a date. Teams that run this check catch design rot in one quarter; teams that skip it find out at annual planning, when everything is harder to unwind.
Common SPM mistakes
Comp-first implementation. Buying a commission engine before fixing quota and territory design pays people accurately against the wrong numbers. Plan capacity, then quota, then comp.
Annual-only cadence. Territories, quotas, and comp set each January and untouched until next January drift from reality within a quarter. Quarterly reviews with rule-based adjustments keep the system honest without inviting constant renegotiation.
Averages instead of distributions. A 70% average attainment can be five reps at 140% and ten at 35%. The distribution is the diagnostic; the average is decoration.
Ignoring ramp in performance reviews. Measuring a month-four rep against a tenured quota produces false negatives, burns new hires, and corrupts the attainment data the next planning cycle will use.
How Lative powers the planning side of SPM
Lative is built for the component SPM implementations most often lack: capacity-grounded planning.
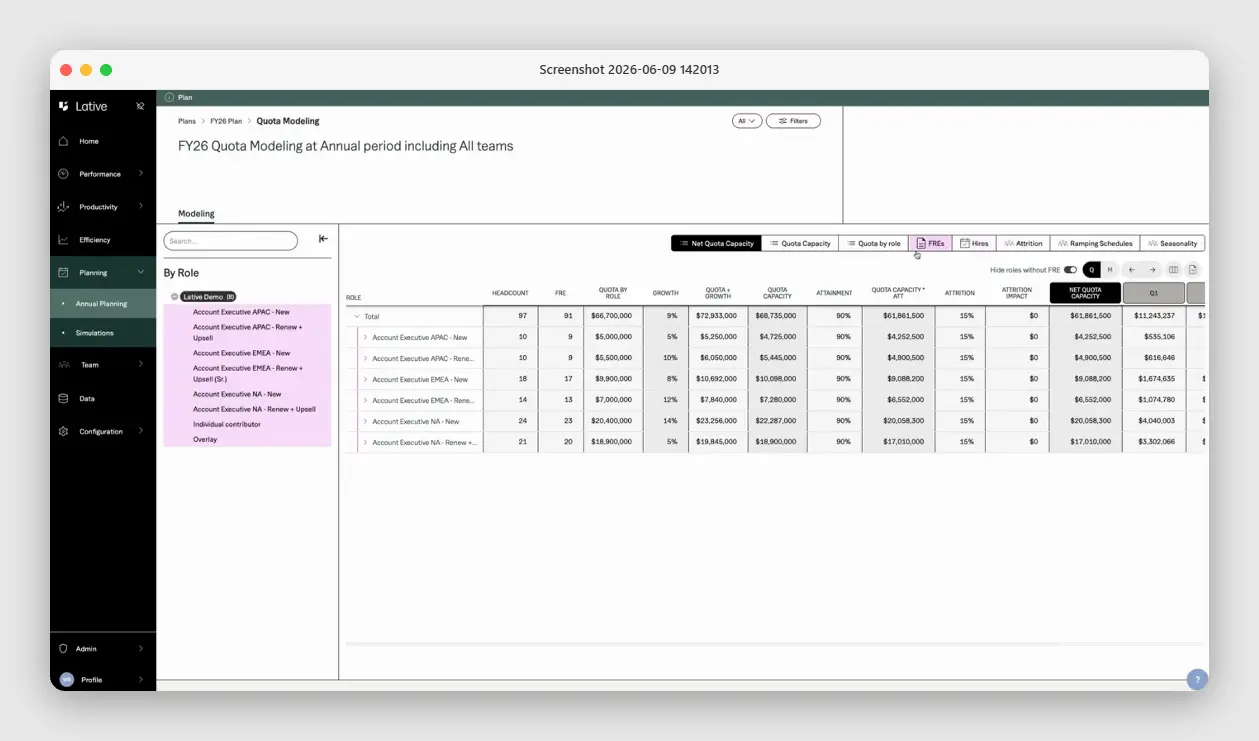
The Productivity module establishes what each rep actually produces, by segment and tenure-adjusted; Average Ramping Time turns hire cohorts into real ramp curves; and the Quota Modeling view rolls ramp schedules, seasonality, attrition, and quotas by role into net quota capacity, expressed in fully ramped equivalents, so you see what assigned quota actually delivers after ramp and attrition drag.
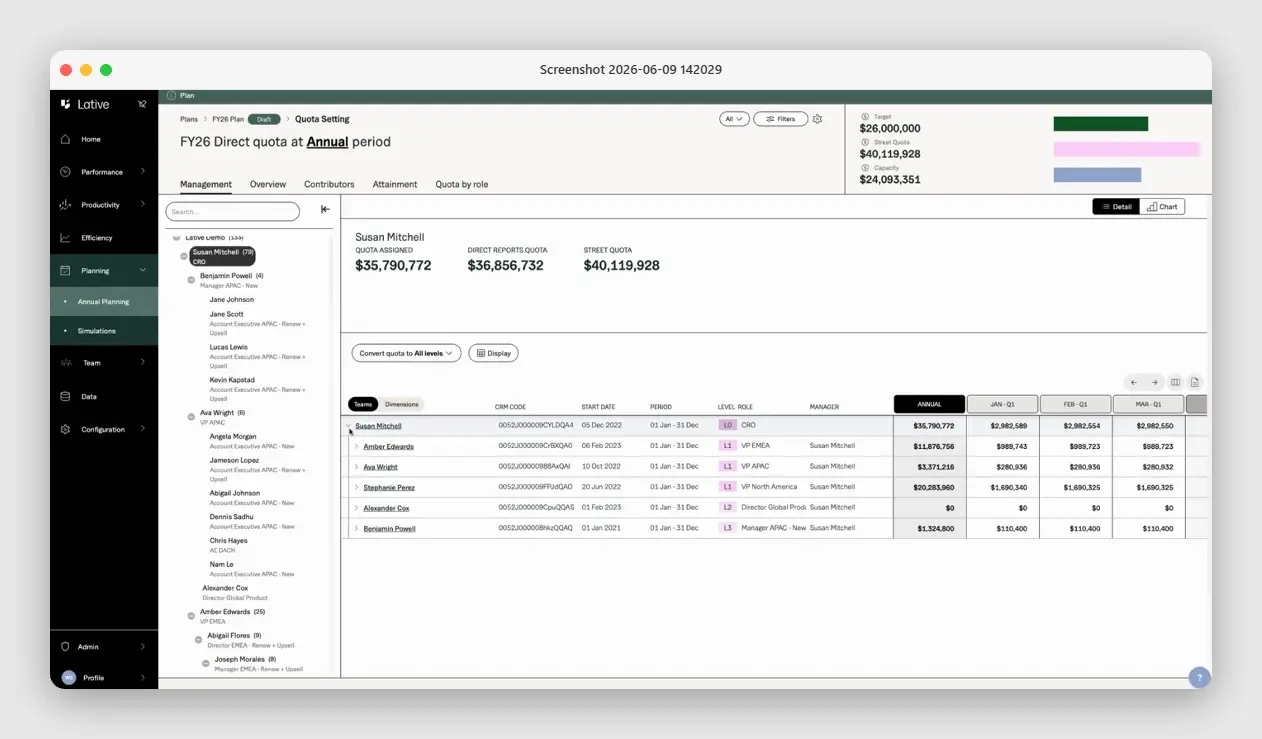
Quota Setting then automates the rollout, showing assigned versus direct-reports versus direct quota per leader, checked against capacity, so over-assignment surfaces before the year starts. The result: comp plans pay against targets that were achievable by construction, and the performance conversations that follow are about performance, not planning debris.
Key takeaways
- SPM connects targets, territories, quotas, comp, and measurement into one system where a change flows through the rest.
- Capacity is the load-bearing component: every other piece assumes the roster can produce the number.
- Most SPM failures are planning failures, not comp failures — fix the inputs and most execution problems disappear.
- Read the attainment distribution, not the average; a 70% mean can be five stars carrying ten misses.
Frequently asked
What is sales performance management?
The connected set of processes and tools for planning, managing, and improving sales team performance: territory design, quota setting, incentive compensation, capacity planning, and measurement operating as one system.
What are the main components of SPM?
Territory management, quota management, incentive compensation, capacity and headcount planning, and analytics. The capacity component is load-bearing: every other piece assumes the roster can produce the number.
Who owns sales performance management?
Usually sales leadership with RevOps or sales ops running the system, and finance owning the comp budget. The planning inputs should be jointly signed off by all three.
What is the difference between SPM and a CRM?
The CRM records deal activity. SPM decides how the team is structured, targeted, and paid. Most SPM tools sit on top of the CRM.
Is SPM only for large companies?
No. The discipline matters from the first quota ever assigned. The tooling gets heavier with scale, but capacity-grounded quota setting pays off at any size.
What metrics does SPM track?
Quota attainment and its distribution, territory balance, comp cost of sales, ramp time, and productive capacity utilization.
Get SPM right and the whole team pulls in one direction against numbers they can actually hit. Get it wrong and you pay for it in disputes, attrition, and missed quarters. See the full sales capacity planning guide, or book a demo to see capacity-grounded quota modeling live.