This free quota attainment calculator gives you both numbers that matter: team attainment against target, and the share of reps individually hitting quota. Enter your figures and the result updates as you type.
Quota Attainment Calculator
How this quota attainment calculator works
The calculator computes the two numbers that get conflated in almost every QBR. Team attainment is actual revenue closed divided by the quota target: it tells you how close the team landed to the number.
Rep attainment rate (also called quota participation) is the share of reps who individually hit 100% or more: it tells you whether the number was earned broadly or carried by two stars. The inputs are deliberately simple: the period’s quota target, actual closed revenue, total quota-carrying reps, and how many of them hit their individual number.
The two outputs tell different stories on purpose. A team can post 95% attainment with only three of ten reps at quota, which means the plan worked and the quota design did not, or post 78% with seven of ten at quota, which usually means one big territory missed. Read them together, always.
How to read your results
Benchmarks give the outputs meaning. On participation: healthy SaaS teams see 60 to 80% of ramped reps hit quota. The industry currently runs far below that: The Bridge Group’s 2024 SaaS AE Metrics Report (n=419 SaaS companies) found only 51% of AEs hit quota in 2024, down from 66% in 2022, and RepVue’s Q2 2025 Cloud Sales Index measured a 57.31% miss rate with average attainment of 42.69% across roughly 47,000 reps.
- Participation above 90%: quotas are probably soft. You are likely overpaying commissions for revenue that was coming anyway, and the board target deserves a second look.
- Participation 60 to 80%: the healthy band. Quotas stretch most reps and remain credible.
- Participation 40 to 60%: a warning. Check whether misses cluster in ramping cohorts or specific territories before blaming execution.
- Participation below 40%: a quota-setting problem, not a talent problem. Targets were almost certainly set above what the roster could produce.
Segment before you conclude
Run the calculator separately for each segment and tenure band before drawing any conclusion, because blended attainment hides exactly the patterns that matter. A typical split: ramped mid-market reps at 74% participation, ramped enterprise at 45%, and ramping reps at 30% against full quotas they should never have carried.
The blend reads 55% and suggests a general performance problem; the segments read as one enterprise quota-design issue plus one ramped-quota policy gap, both fixable this quarter.
The same discipline applies across time: a single quarter’s attainment is weather, four quarters is climate. Track each segment’s participation as a trend line, and treat any two-consecutive-quarter decline as a planning trigger rather than a coaching topic, because by the time attainment declines twice, the cause has usually been operating for three.
Worked example one: the star-carried quarter
A hypothetical eight-rep team carries a $2.4M quarterly target and closes $2.16M: 90% team attainment, a defensible headline. Participation: two of eight reps hit quota. The two stars closed $1.3M between them; the remaining six averaged 54% of their individual numbers.
The diagnosis is structural: either six territories cannot support their quotas, or the quota math ignored ramp and mix. The headline said fine; the participation said fix the plan before two resignations turn 90% into 60%.
Worked example two: the honest miss
The same team closes $1.92M, 80% team attainment, with five of eight reps at quota. Participation says the quota design is broadly sound; the miss concentrates in one enterprise territory that produced $180K against a $480K number.
That is not a quota redesign, it is a one-patch diagnosis: pipeline, coverage, or a deal that slipped. The response is surgical, not systemic. Same team, similar headline numbers, opposite conclusions, which is exactly why the calculator reports both figures.
The monthly attainment review agenda
Fifteen minutes, three views, owners assigned. First, pace: attainment-to-date against the linear pace line, by segment, with any segment below 80% of pace flagged. Second, distribution: the participation histogram, watching for clustering below comp thresholds and for ramping reps measured against the wrong baseline.
Third, exceptions: every rep below 50% of pace gets a named diagnosis, territory, pipeline, ramp, or skill, and a dated action, because “we’ll watch it” is how week-six problems become quarter-end surprises. The review is short precisely because the calculator math is simple; the value is in forcing the diagnosis while there is still time to act on it.
What attainment cannot tell you on its own
Attainment is an output metric. It tells you what happened against the target; it cannot tell you whether the target was ever achievable, and that is its structural limit. To diagnose low attainment you need the inputs underneath: trailing attainment by segment, cohort ramp curves, territory opportunity scores, and ramp-adjusted productive capacity.
The full framework is in what is quota attainment, the benchmark context in quota attainment benchmarks, and the capacity math in how to calculate sales capacity.
Three specific blind spots to keep in mind. Ramp distortion: a team mid-hiring-wave will post low participation even with perfect quota design, because ramping reps belong on ramped quotas measured against the cohort curve.
Comp clustering: attainment bunching just below an accelerator threshold reflects comp design, not capacity, and should not feed the next quota cycle raw. And mix shifts: a quarter where deal mix moved from enterprise to mid-market can hold attainment flat while the engine underneath changed completely.
Setting next quarter’s quota from this quarter’s attainment
The calculator’s most valuable use is prospective, not retrospective. Take each segment’s trailing four-quarter attainment for ramped reps, that is your realistic productivity rate, and derive next quarter’s quotas from it rather than from the target divided by headcount.
A segment averaging 68% attainment on $300K quotas is a $204K-per-rep engine: if the plan needs $240K per rep, the honest options are a productivity program, a pipeline investment, or more heads, and the calculator has just priced the gap for you.
What the trailing rate is not: a reason to lower ambition automatically. It is the baseline that makes the stretch explicit and fundable, instead of silent and demoralizing. Teams that run this loop, attainment measured, rate derived, quota set from the rate, stretch named and resourced, see the calculator’s two numbers converge over time, which is what a working quota system looks like.
From measuring attainment to fixing it
Low attainment has exactly four structural causes: quotas above capacity, territories below opportunity thresholds, ramp ignored in target setting, and pipeline coverage gaps. Each has a different fix, and all four are visible in advance in a capacity model.
Lative runs that model live:
- Productivity establishes real production per rep, tenure-adjusted and segmented.
- Average Ramping Time derives ramp curves from your actual hire cohorts.
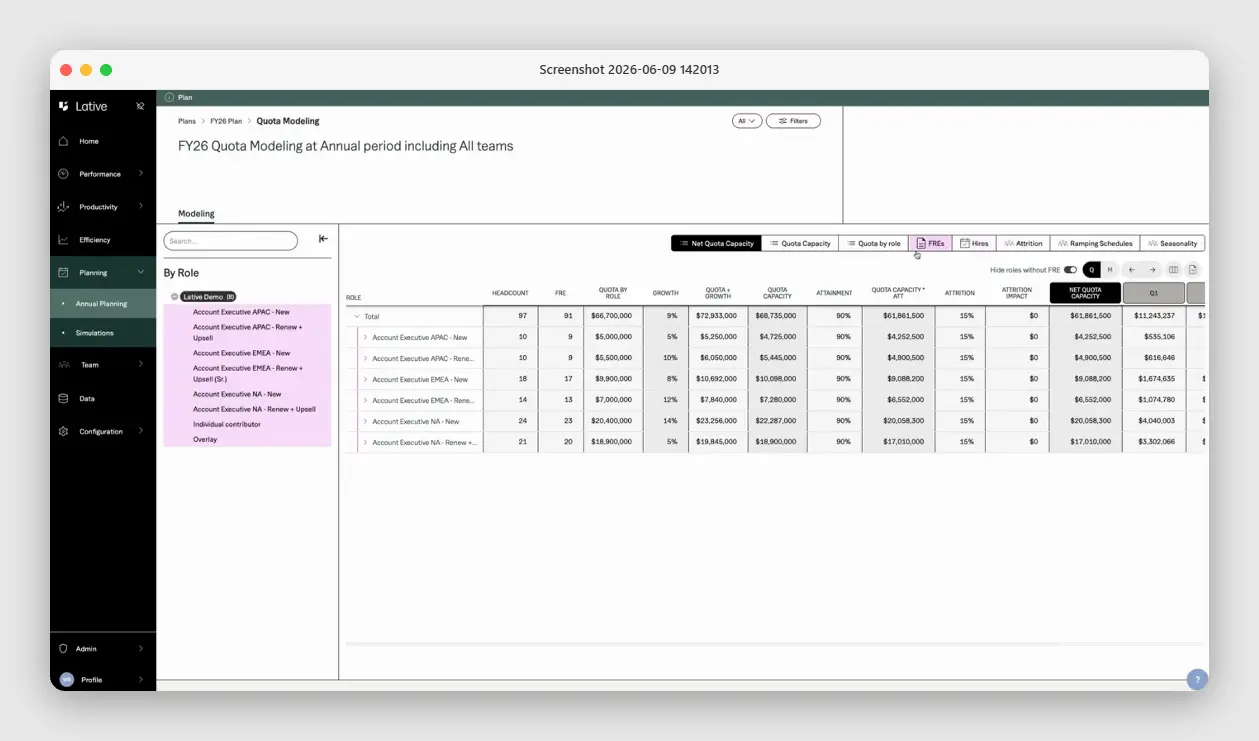
- Quota Modeling rolls ramp schedules, seasonality, and attrition into net quota capacity by role, the number quota should be derived from.
- Quota Setting shows assigned quota against capacity per leader, so over-assignment surfaces before the year starts instead of in this calculator afterward.
Attainment becomes a confirmation, not a surprise.
Frequently asked
How do you calculate quota attainment?
Actual revenue closed divided by quota target, times 100. For a team, sum both sides; also track participation, the share of reps individually at 100% or more, because the average hides the distribution.
What is a good quota attainment rate?
60 to 80% of ramped reps hitting quota is healthy. The 2024 industry average was 51% of reps (Bridge Group), which reflects widespread quota-setting problems, not a talent collapse.
What is the difference between attainment and participation?
Attainment is dollars against target. Participation is the share of reps who hit their individual number. A team can post high attainment with low participation when stars carry the number.
Should ramping reps count in attainment calculations?
Against ramped quotas, yes; against full quotas, no. Measuring month-three reps on tenured targets corrupts both the metric and the morale.
What should you do if attainment is below 50%?
Audit the inputs before managing the people: quota versus capacity, territory opportunity scores, ramp assumptions, and coverage by segment. Below 50% is almost always a planning failure.
How often should you measure quota attainment?
Monthly for pace, quarterly for decisions, and always alongside the distribution. Annual-only reviews discover problems after they have compounded.
One last calibration on the benchmarks above: industry averages describe the industry, not your business. A 51% participation rate is the market’s report card, and matching it is not a goal. Your own trailing rates, by segment and tenure band, are the only baseline worth planning against, which is why the calculator matters most when you run it consistently, on the same definitions, quarter after quarter.
Measure attainment with this calculator, then make next quarter’s number one the team can actually hit. See the full sales capacity planning guide, or book a demo to derive quotas from capacity instead of hope.