This free sales velocity calculator turns four pipeline inputs into revenue per day. Enter your opportunities, win rate, average deal value, and cycle length; the result updates as you type.
Sales Velocity Calculator
The sales velocity formula
Sales velocity measures how fast revenue moves through your pipeline, expressed as dollars per day:
Sales Velocity = (Opportunities x Win Rate x Average Deal Value) / Sales Cycle Length
The calculator above runs it live. Four inputs, one output, and the output is the single most compressed summary of a sales motion’s health: how much revenue does the engine produce per day of operation. Two motions with identical quarterly bookings can have very different velocities, and the difference predicts which one scales.
The four levers, and what each costs to move
- Opportunities. The volume input. More qualified pipeline raises velocity linearly, and it is the most expensive lever: more demand spend, more SDR capacity, longer payback. It is also the lever most teams reach for first, including when it is not the constraint.
- Win rate. The quality input, and usually the highest-return lever. Moving win rate from 20% to 24% lifts velocity 20% with zero added spend. Landbase’s 2026 analysis puts the average B2B win rate at 21% overall and 29% for qualified pipeline, which is itself the argument for tighter qualification: the same deals, better filtered, convert meaningfully higher.
- Average deal value. Pricing, packaging, and multi-year terms. Powerful, with a catch the formula makes visible: bigger deals usually stretch the cycle, so the numerator and denominator move together.
- Sales cycle length. The denominator, and the quietest lever. Removing two weeks from a 90-day cycle lifts velocity 18% without touching demand, price, or conversion, which is why stuck-stage analysis is chronically underrated.
Getting honest inputs out of your CRM
The calculator is only as good as its four inputs, and each has a standard corruption. Opportunities: count only deals that passed a written qualification bar in the period, not everything reps created; the difference is commonly 30% or more.
Win rate: use closed-won divided by all closed (won plus lost) for the trailing two to four quarters, by segment, and resist the urge to exclude “bad” losses, because next quarter will have those too.
Average deal value: use the median if a few whales distort the mean, or compute velocity separately for whale deals, which behave like a different business.
Cycle length: measure from the qualification stage to close, not from lead creation, and audit a sample of close dates against reality, because auto-rolled dates shorten the cycle on paper and nowhere else. An hour of input hygiene changes the output more than any lever discussion.
Worked example one: finding the binding constraint
A hypothetical mid-market team runs 120 opportunities a quarter at a 22% win rate, $18,000 average deal, 60-day cycle. Velocity: 120 x 0.22 x 18,000 / 60 = $7,920 per day, roughly $713K per quarter. Leadership wants 25% more.
The four paths, priced: lift opportunities to 150 (a 25% demand increase, the costly route); lift win rate to 27.5% (a qualification and coaching program); lift deal value to $22,500 (packaging and discount discipline); or cut the cycle to 48 days (stage friction analysis).
Running each through the calculator shows they are mathematically equivalent, which converts the strategy meeting from opinion to costing: which 25% is cheapest for this team, this year? For most teams the honest answer is win rate or cycle, because both improve with process rather than spend.
Worked example two: the velocity mirage
The same team doubles opportunity volume to 240 by loosening qualification. Velocity on paper doubles to $15,840 per day. Reality: win rate slides to 13% as reps drown in junk, the cycle stretches to 75 days as attention fragments, and actual velocity lands at 240 x 0.13 x 18,000 / 75 = $7,488 per day, below where it started, with twice the working load.
The formula catches what the pipeline review missed: the levers interact, and volume bought with qualification debt is negative-interest revenue. This is the single most common velocity mistake in scaling teams.
Where capacity comes in
Velocity assumes the opportunities get worked. Add pipeline your team cannot cover and the formula silently breaks: opportunities sit, cycle lengthens, win rate decays, and paper velocity diverges from cash. The supply-side check is capacity: how many opportunities can the ramped roster actually work at quality? A velocity plan that ignores it produces exactly the mirage in example two.
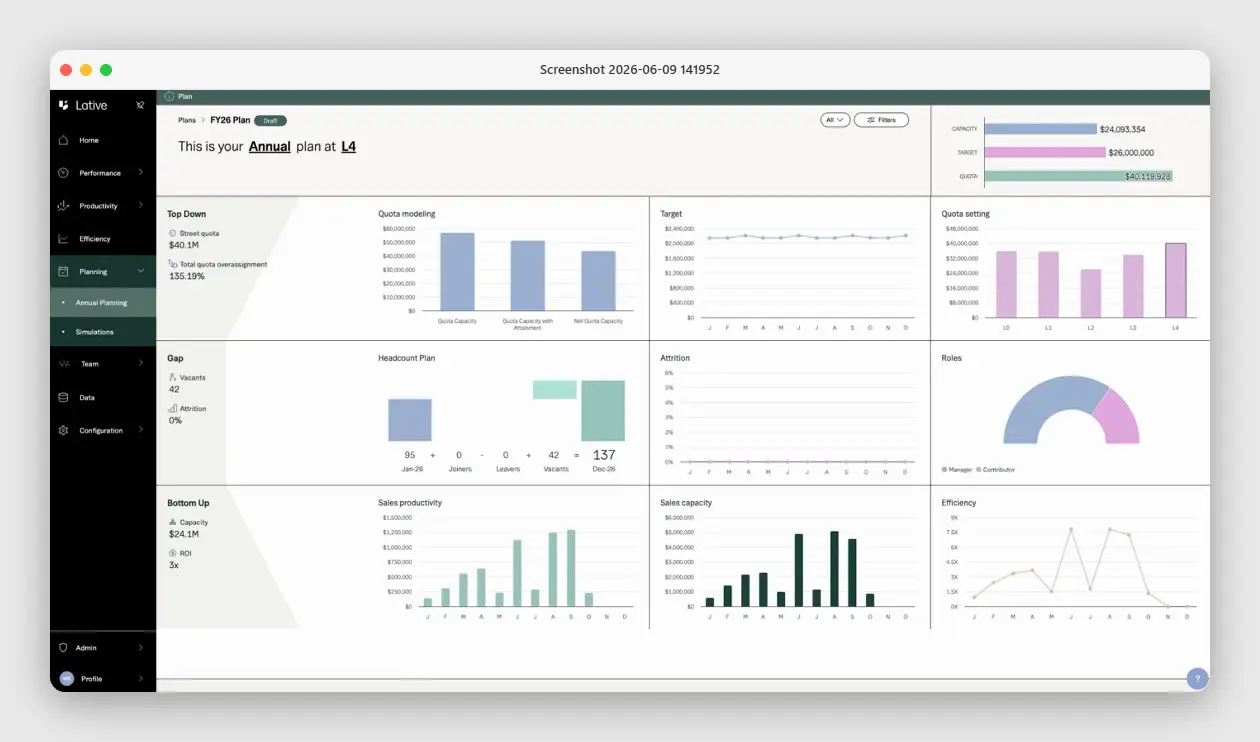
This is why velocity and capacity belong in the same model: Lative’s Annual Planning view holds pipeline and productive capacity side by side, the Productivity module supplies real per-rep throughput by segment, and Average Ramping Time keeps the supply forecast honest when the team is mid-hiring-wave.
Run the demand math here, then check it against supply before committing the number; see how to calculate sales capacity for the other half.
Velocity by segment: a quick reference pattern
Expect the shape, not the numbers, to repeat across companies. SMB motions run high-volume, moderate win rate, small deals, short cycles: velocity is volume-driven, and qualification drift is the main failure mode. Mid-market runs balanced inputs: velocity responds best to win-rate work.
Enterprise runs low volume, lumpy deals, long cycles: a single quarter’s velocity is nearly meaningless, trailing-twelve-month velocity is the honest reading, and cycle compression, one less procurement loop, one earlier security review, is usually the cheapest lever. Matching the lever to the segment’s shape is most of velocity management.
Using velocity as an operating metric
Velocity earns a place in the weekly review under three disciplines. Segment it: SMB and enterprise velocities are different machines, and the blend hides both; compute one velocity per segment, per quarter. Trend it: a single reading is trivia, four quarters is a diagnosis, and a two-quarter decline is a planning trigger that names its own cause in the four inputs.
And decompose every change: when velocity moves, attribute the move to the lever that drove it before celebrating or panicking, because a velocity gain from deal-size mix can mask a win-rate decay that compounds next quarter. Teams that track velocity this way catch motion problems, qualification drift, stage friction, pricing erosion, a quarter or two before they reach the bookings line.
Common velocity mistakes
Computing it blended. One velocity across segments produces a number that describes neither and trends that explain nothing.
Gaming the inputs. Counting unqualified pipeline as opportunities or measuring the cycle from a stage reps enter late both inflate the output. Use written stage definitions and the same boundaries every quarter; see what is pipeline coverage for the qualification discipline.
Optimizing one lever in isolation. Every lever touches the others: price moves cycle, volume moves win rate. Model the interaction, then commit.
Treating velocity as a forecast. Velocity is a rate, not a prediction. It tells you the engine’s speed, not whether this quarter’s specific deals will land; the forecast needs deal-level inspection and capacity context on top.
Frequently asked
How do you calculate sales velocity?
Multiply the number of qualified opportunities by win rate and average deal value, then divide by sales cycle length in days. The result is revenue per day.
What is a good sales velocity?
There is no universal benchmark; it scales with deal size and motion. Track your own number by segment and judge the trend, not the level.
Which velocity lever should you improve first?
Usually win rate or cycle length: both improve with qualification and process rather than spend, and at a 21% average B2B win rate most teams have more headroom in quality than in volume.
Why did my velocity go up but bookings stay flat?
Usually input inflation: looser qualification raised the opportunity count while win rate quietly fell. Decompose the change by lever, and check whether the team had capacity to work the added volume.
Is sales velocity the same as pipeline velocity?
The terms are used interchangeably. Both refer to the four-input formula; what matters is consistent definitions for what counts as an opportunity and where the cycle starts.
How often should you measure sales velocity?
Quarterly for the official reading, monthly for the trend, always by segment, and always alongside the capacity check that confirms the volume is workable.
A final note on what velocity is for: it is a conversation compressor. Four inputs and one output mean that any disagreement about the motion’s health resolves into a disagreement about a specific input, which is checkable, instead of a debate about vibes, which is not. Used that way, weekly, by segment, with honest inputs, it is one of the highest signal-per-minute metrics a revenue team can run.
Run your numbers in the calculator, find your binding constraint, and check the demand math against capacity before you commit it. See the full sales capacity planning guide, or book a demo to see velocity and capacity in one model.