The board has asked you to do more with less. Again. In 2026, the “efficiency first” pressure that started in 2023 has calcified into a default posture: marketing headcount is flat, program budgets are held or cut incrementally, and the expectation is that AI productivity gains absorb the gap.
I’ve sat in enough of these budget reviews to tell you what happens next. The cuts go through. The quarter looks fine. Then, six to ten months later, someone in a planning meeting asks why pipeline coverage is thin. Nobody connects it back to the decision made almost a year ago.
HubSpot found that 73% of marketing organizations now face more budget scrutiny than in prior years. Yet cutting programs that feed future pipeline produces the very revenue misses that trigger the next round of cuts.
Understanding net pipeline: the metric that tells the truth
Net pipeline, the actual rate at which your GTM engine builds versus burns through opportunity inventory, cannot be improved by efficiency measures alone. It is a math problem, and most teams are not tracking the right math.
The math reads: Net Pipeline = (New Logo Pipeline Added + Expansion Pipeline Added + Pipeline Won) minus Pipeline Retired. A positive number means the engine is building faster than it burns through opportunity inventory. A negative number is the warning your gross pipeline coverage ratio hides for at least one quarter.
Most organizations track gross pipeline coverage at a 3:1 or 4:1 benchmark and read that ratio as health. The weighted pipeline coverage version, in which each opportunity is discounted by its stage-by-stage conversion rate, tells a different story. A 3:1 gross ratio can be a 1.4:1 stage-weighted forecast once you apply historical win rate by stage. Net pipeline is what the weighted view exposes that the gross view hides.
Most organizations track gross pipeline added and gross pipeline won, ignoring the metric that tells the truth: what did the engine actually build, minus what it retired? That gap is where the next missed quarter lives.
Net pipeline is simple to define and consistently undertracked:
Net Pipeline
A positive net pipeline means the GTM engine added more than it retired in the period. A negative net pipeline means the opposite. It is one of the most reliable early warning signals that revenue will miss plan in the next one to three quarters.
Most reporting frameworks track gross pipeline added and gross pipeline closed. Net pipeline, which accounts for all pipeline retired (lost, disqualified, withdrawn, and stalled), is the metric that tells you whether the engine is building momentum or burning through reserves.
The four components of net pipeline change
Every quarter, you and your CRO should jointly account for each of these four movements:
- New logo pipeline added. Net new opportunities created from accounts that have not previously been customers. This is marketing’s primary contribution and the most direct signal of top-of-funnel health.
- Expansion and renewal pipeline added. Opportunities from existing customer accounts, including upsell, cross-sell, and renewal. Marketing’s account-based coverage plays a meaningful role here even when it goes uncredited.
- Pipeline won. Opportunities that closed as revenue. The positive exit from the system and the entire goal.
- Pipeline retired (non-won). Opportunities lost to competitors, disqualified after closer inspection, stalled indefinitely, or withdrawn by the prospect. This is the leak. High retirement rates relative to additions are a structural problem, not a one-quarter anomaly.
When net pipeline is broken down by market segment, the diagnostic value multiplies. A company might show positive net pipeline overall while experiencing severe negative net pipeline in its most important enterprise segment. Aggregate reporting hides this. Segment-level tracking surfaces it in time to respond.
Net pipeline quality: the difference between koalas and grizzlies
Not all pipeline additions are equal. Some opportunities are grizzlies: strong fit, multiple stakeholders engaged, clear budget path, high conversion probability. Some are koalas: friendly at intake, slow-moving, comfortable to carry in the pipeline number, but unlikely to close.
A February 2026 analysis of more than one million sales cycles found that won deals in the $50K–$250K range typically involve at least 10 stakeholders by close. Opportunities with fewer than three engaged contacts at the point of pipeline creation have materially higher retirement rates.
Tracking stakeholder count alongside pipeline value is one of the clearest early signals of whether an addition is a grizzly or a koala.
How Retirement Rate Spikes Signal Pipeline Quality Problems
Gross pipeline addition rates treat both the same. Net pipeline math does not. When retirement rates spike, it is usually because the prior quarter’s addition rate included a disproportionate share of koalas. They were added in optimism, carried through one quarter, and retired when the next stage qualification exposed the gap.
The CMO watching only additions sees a healthy intake. The CMO watching net pipeline sees the retirements arrive and understands the quality problem before the CRO brings it up in a review.
This is why joint CMO-CRO net pipeline reviews are more valuable than separate marketing and sales pipeline reviews. Marketing controls additions. Sales controls retirement rates. The net number belongs to both.
Lative’s Real-Time Net Pipeline Tracking by Segment
Lative’s Marketing Intelligence tracks net pipeline in real time across segments, so the CMO sees retirements and additions moving together rather than discovering the retirement spike at the next joint review.
Forrester’s B2B Revenue Waterfall research has documented consistently that organizations with aligned pipeline definitions achieve significantly higher forecast accuracy than those operating on separate definitions.
The lag problem: why budget cuts feel safe until they don’t
The dangerous thing about GTM budget cuts is the lag. When a company reduces marketing investment, the pipeline generated by that investment takes two to four months to materialize. The deals in that pipeline take another three to six months to close. The full revenue impact of a cut does not show up for six to ten months.
During that window, the existing pipeline in the system is still closing. Revenue looks fine. Margins look better because costs are down. The CFO concludes marketing spend was inefficient. What actually happened: the investment being “proven unnecessary” by the short-term numbers was the investment that built the pipeline the company is currently closing.
This is the scenario I call the Type 3 moment: mid-year, the company realizes it will miss the annual goal because nobody tracked the plan against actuals regularly enough to see the signal coming. The net pipeline data was telling the story for months. The team was not looking.
The Weekly Demand Council Prevents the Type 3 Moment
I’ve sat in that meeting. It is entirely preventable with a weekly Demand Council review cadence and real-time net pipeline visibility by segment.
Net pipeline tracking breaks this illusion. If marketing spend is cut in Q1, you will see the addition rate begin to slow by Q2. By Q3, if additions have dropped materially while retirements hold steady, the net pipeline number turns negative. That signal is visible six months before the revenue miss lands.
The capacity planning connection most teams miss
Negative net pipeline quarters do not just hurt the quarter they occur in. They compress the pipeline available to the sales team in the quarters that follow, Sales cycle length compounds this effect: a 9-month enterprise cycle needs a higher net pipeline cushion than a 90-day mid-market cycle, because pipeline velocity is slower and stage-by-stage conversion rates have more time to drift.
This forces capacity utilization decisions based on a demand signal that has already deteriorated. A CRO who makes hiring or territory decisions in Q3 based on Q2 coverage ratios, without accounting for the net pipeline decline that happened in Q1, is planning against numbers that no longer represent the real demand environment.
The connection between marketing’s net pipeline signal and sales capacity planning is where most organizations have a structural gap. Marketing produces the demand, sales allocates capacity against it. But the two planning cycles typically happen in parallel, not in sequence. A net pipeline deterioration visible in marketing’s data does not automatically trigger a sales capacity recalibration.
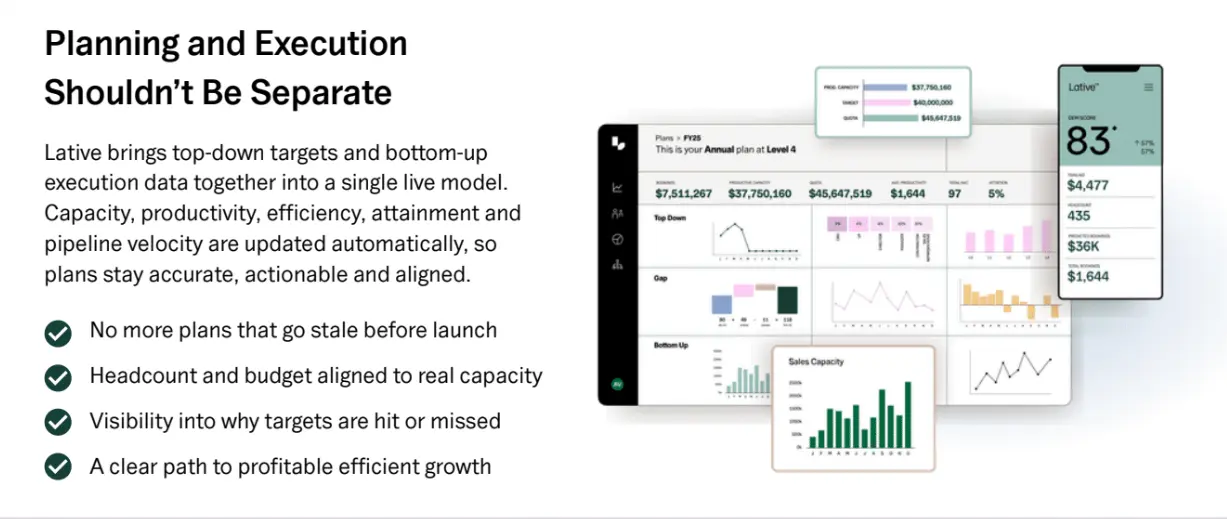
Lative’s platform closes that gap by connecting Marketing Intelligence’s net pipeline view directly to the sales capacity planning model. The same data foundation that tracks pipeline additions and retirements by segment also informs how many quota-carrying reps are needed to work the pipeline that actually exists, not the pipeline the plan assumed would exist.
What 2026 teams have that 2023 teams did not
The 2023 budget cuts were made, in many cases, without real-time visibility into pipeline composition. Teams were managing against lagging revenue metrics and could not see the net pipeline signal deteriorating until the miss was already baked in.
In 2026, that excuse is gone. AI-native GTM platforms track net pipeline by segment, by quarter, and in real time, with AI-generated narratives that explain what is driving the change and forecast where the trajectory is heading. The CMO and CRO should be reviewing net pipeline by segment at every joint operating review, not discovering the problem in the post-mortem.
When AskNicely rebuilt their demand engine on Lative’s data foundation, they gained continuous segment-level net pipeline visibility rather than quarterly retrospectives. They cut cost per opportunity by 30% in one quarter. The signal that enabled that outcome was a data infrastructure that made the net pipeline math visible before the miss was baked in.
Key takeaways
- Net pipeline reveals what gross coverage ratios hide. A stage-weighted forecast can be half the gross number once historical win rates are applied.
- Pipeline retirement is the leak. Track it by segment and you will see a negative net pipeline before the revenue miss shows up in the forecast.
- Koalas inflate gross pipeline. Grizzlies move the weighted number. The difference is visible in stage-by-stage conversion rates, not aggregate coverage.
- Longer sales cycle length demands higher net pipeline velocity. A 6-month closing cycle needs a different coverage cushion than a 90-day cycle, even at identical win rates.
- Budget cuts feel safe in the quarter they happen because the damage hides in net pipeline for one to two cycles. By the time the revenue forecast catches it, the fix is two quarters out.
Frequently asked
What is the difference between net pipeline and gross pipeline coverage?
Gross pipeline coverage is the ratio of total open pipeline value to the revenue target. Net pipeline subtracts pipeline retired from pipeline added and pipeline won, exposing whether the engine is building faster than it is losing. Gross can look healthy at 3:1 while net is negative.
Why does net pipeline signal a revenue miss two quarters out?
The lag is built into the sales cycle. A negative net pipeline quarter starves the closing inventory two cycles later. With a 90-day cycle that is six months. With a 6-month enterprise cycle that is a year. Forecast accuracy degrades the further you sit from the quarter the leak started in, which is why coverage ratios alone always catch the miss late.
How do we separate gross and net pipeline if our CRM does not track retirement separately?
The data is already in the records. It is just not labeled. Every closed-lost, disqualified, or staled-out opportunity is a retirement. Build a retirement category from the close-stage and close-date fields on those records. Then compare retirement value to gross pipeline added over the same window. The negative gap is the leak the gross view never showed you.
Further Reading: Manifesto and Demand Engine Math
The 2026 revenue marketing manifesto frames the operational principles that prevent this from happening in the first place. For the pipeline math behind it, the demand engine mastering framework covers coverage ratios and conversion chains from the CMO’s perspective.
Net pipeline only tells the full story when it is read against capacity. Lative connects the two on one platform, extending the same model into sales capacity planning so the pipeline you build is matched to the capacity that can close it.
If your last revenue miss showed up as a surprise in the quarterly post-mortem, the signal was in your net pipeline data six months earlier. See how Lative tracks net pipeline across your GTM segments in real time.
Werner Schmidt — Werner Schmidt is the CEO and Co-founder of Lative, with over 20 years of experience in Revenue Operations with companies including Forcepoint, Aruba Networks, Citrix, and Sage.