Sales productivity is one of those terms everyone uses and few define. It is not how busy your reps look, how many calls got logged, or how full the calendar is. It is how much revenue you get out of the time, headcount, and cost you put in, and for most teams it is quietly declining while activity metrics climb.
The decline shows up in the attainment data. The Bridge Group’s 2024 SaaS AE Metrics Report (n=419 SaaS companies) found average AE quota attainment fell to 51% in 2024 from 66% in 2022, and RepVue’s Q2 2025 Cloud Sales Index put average attainment at 42.69% across roughly 47,000 reps.
Teams are not less busy than they were in 2022. They are less productive, and the difference between those two words is the subject of this guide: what sales productivity is, how to measure it properly, what drags it down, and how to raise it without simply hiring more people.
Sales productivity, defined
Sales productivity is the ratio of output to input across a sales team. Output is revenue, bookings, or closed deals. Input is the reps, selling time, and money it took to produce them. A productive team converts each rep and each selling hour into more revenue than an unproductive one, at the same or lower cost.
The definition matters because it rules out the most common substitute: activity. Calls, emails, and meetings are inputs, not outputs. A team that doubles its activity while revenue stays flat has become half as productive, even though every dashboard looks twice as green.
How to measure sales productivity
Five measures, in descending order of how much they tell you:
- Revenue per rep. Total new revenue divided by quota-carrying headcount. The headline number, and the right starting point, but raw revenue-per-rep punishes teams that are hiring fast, because ramping reps drag the average down.
- Tenure-adjusted productivity. Revenue per rep adjusted for where each rep sits on the ramp curve, so a team full of month-three hires is not judged like a tenured one. This is the number that belongs in the capacity plan, and the one that makes hiring-phase productivity comparable quarter to quarter.
- Productive capacity utilization. Actual production divided by ramp-adjusted productive capacity. It answers the question raw attainment cannot: is the team underperforming its real capability, or was the capability overstated? The math behind the denominator is in how to calculate sales capacity.
- Selling-time share. The fraction of a rep’s week spent in actual selling motion versus CRM admin, internal meetings, and data chasing. Every point of admin recovered is free capacity.
- Win rate and cycle length. Quality measures: how often deals close and how long they take. Productivity gains that come from discounting faster show up here as falling win quality.
A worked example
Take a hypothetical 10-rep mid-market team that closed $6.2M last year. Raw revenue per rep: $620K. Now adjust for composition: seven ramped reps produced $5.6M ($800K each) while three reps hired mid-year produced $600K combined, exactly what their ramp curve predicted.
Tenure-adjusted productivity says the ramped team runs at $800K per rep and the ramping cohort is on track, so the engine is healthy and the $620K headline is a hiring artifact, not a performance problem.
Now run the same team with a different split: seven ramped reps producing $4.9M ($700K each, down from $800K the prior year) and the same on-track ramp cohort.
The headline barely moves, $550K versus $620K, but the diagnosis is opposite: tenured productivity fell 12.5%, and the question becomes what changed, territory quality, pipeline mix, pricing, or selling time. One headline number, two different companies. That is why the adjustment matters.
What drags sales productivity down
- Admin load. CRM updates, internal reporting, and meeting overhead consume selling hours. A rep buried in data entry is an expensive administrator.
- Bad territory design. A rep in a patch with $800K of winnable opportunity cannot produce $1.2M no matter how hard they work. Territory-productivity mismatches masquerade as performance problems for quarters at a time. See what is sales territory planning.
- Quotas detached from capacity. When targets are set by dividing the board number by headcount, reps learn the number is fiction and effort decouples from the plan.
- Slow ramp. Every extra month of ramp is a month of full cost at partial output. Gong’s 2025 onboarding research found early-tenure productivity is measurable and repeatable when tracked, which makes unmanaged ramp a choice.
- Pipeline starvation or flooding. Too little pipeline idles capacity; too much unqualified pipeline burns selling time on deals that were never going to close. Coverage discipline, see what is pipeline coverage, is a productivity lever, not just a forecasting one.
How to improve sales productivity
The levers, in rough order of speed to impact. Cut admin first: automating CRM updates and killing low-value internal meetings returns selling hours this week, not next quarter. Fix pipeline quality second: tightening qualification so reps work fewer, better deals raises both win rate and morale within a quarter.
Fix territory and quota design third: rebalancing patches on real opportunity and setting quotas from capacity, per how to set quotas, removes the structural ceilings.
Compress ramp fourth: better onboarding, early pipeline, and 1:4 manager ratios during ramp turn the same hiring budget into more in-year capacity. Hiring more reps is the last lever, not the first: adding heads to an unproductive system scales the unproductivity, and the data above shows most teams have more room in the system than in the headcount budget.
Running a productivity review that changes anything
Most productivity conversations fail because they happen at the wrong altitude: a team average gets presented, everyone nods, nothing changes. The review that works runs at three levels in thirty minutes.
First the engine: tenure-adjusted productivity for ramped reps, trended over four quarters, which answers whether the core machine is improving or decaying. Second the composition: how much of the headline movement is hiring mix versus engine change, so nobody panics about a number that ramp math fully explains.
Third the outliers: the two or three reps or segments driving most of the variance, each with a named hypothesis, territory, pipeline, skill, or quota design, and an owner to test it before the next review. Run monthly, this cadence converts productivity from a quarterly report into a managed variable, which is the entire difference between teams that drift and teams that compound.
Productivity vs efficiency vs effectiveness
Three cousins worth separating. Productivity is output per input (revenue per rep, per hour). Efficiency is output per dollar (revenue per dollar of sales cost, the CFO’s version). Effectiveness is quality of execution (win rate, deal size, cycle length).
A team can be effective but unproductive (great win rate, no pipeline), or productive but inefficient (high revenue per rep at unsustainable cost). Strong operating reviews track one measure from each family rather than ten from one.
How Lative measures sales productivity
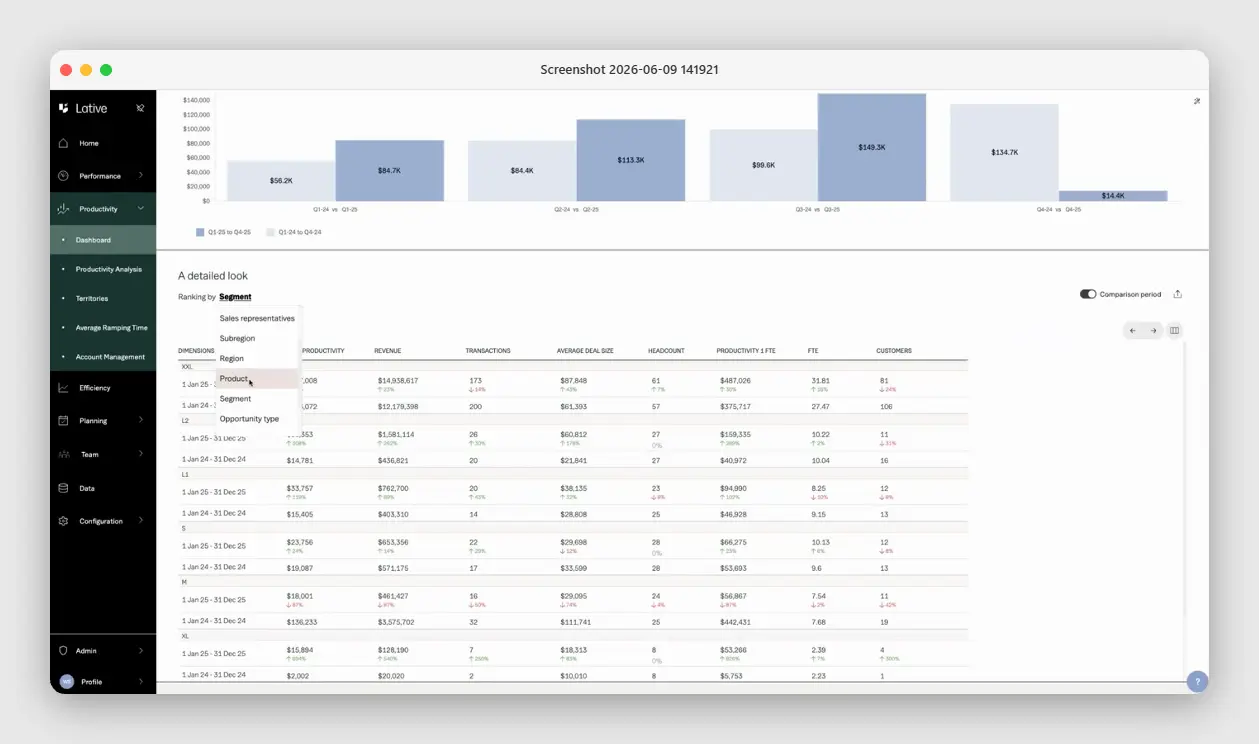
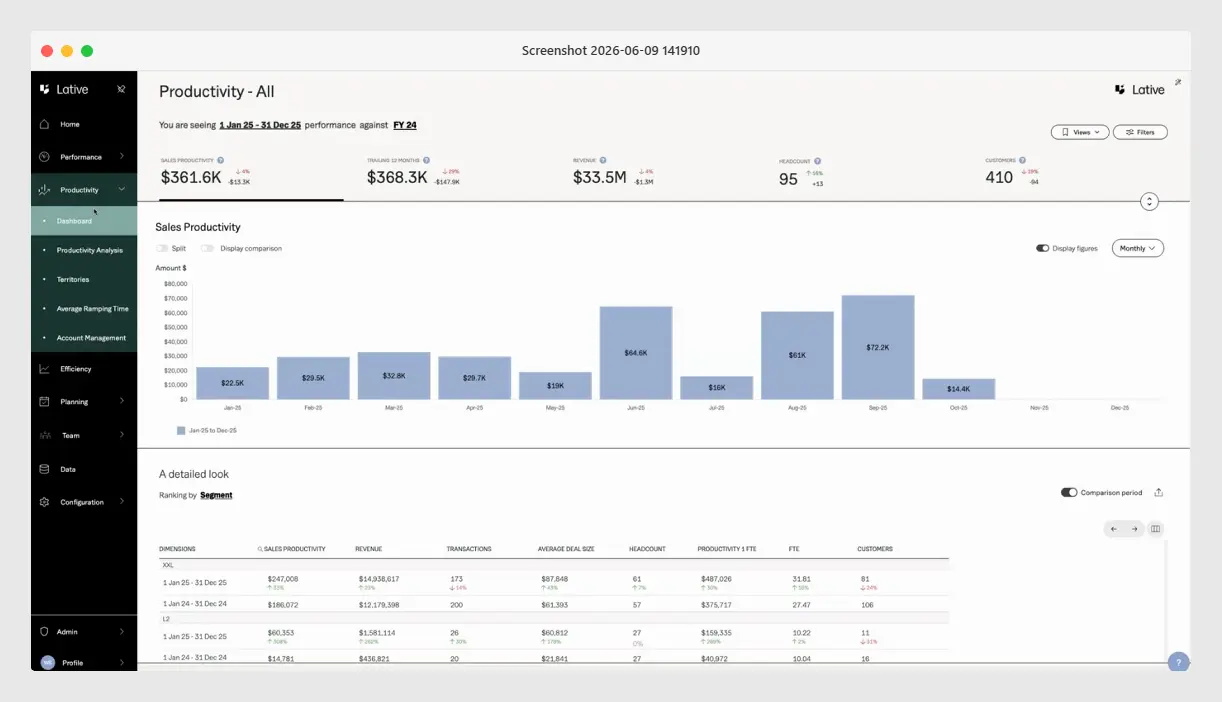
Lative’s Productivity module computes this directly from closed-won data: production per rep, tenure-adjusted productivity, revenue, average deal size, headcount, FTE, and customers, comparable quarter over quarter and year over year.
The multi-dimensional view breaks production out by sales rep, region, product line, segment, and opportunity type, down to FTE level, so a productivity dip resolves to a specific place instead of a vague concern.
Because the same data feeds the Capacity view, productivity connects straight to planning: when production per rep moves, the capacity number and the hiring math move with it, which is what makes productivity a managed variable instead of a quarterly surprise. The Efficiency view adds the CFO’s lens, return per dollar of sales spend by rep and by segment.
Key takeaways
- Productivity is revenue per unit of rep, time, and cost — not activity; doubling calls with flat revenue halves it.
- Tenure-adjusted productivity is the number that belongs in the capacity plan; raw revenue-per-rep punishes hiring.
- Recover selling time first: cutting admin and meeting load returns capacity this week.
- Hiring more reps is the last lever; adding heads to an unproductive system just scales the unproductivity.
Frequently asked
What is sales productivity?
The ratio of sales output (revenue, bookings, deals) to input (reps, selling time, cost). It measures how much revenue a team converts from the resources it consumes, not how much activity it generates.
What is a good revenue per rep?
It varies widely by segment, price point, and motion. Benchmark against your own tenure-adjusted history first; cross-company comparisons mislead unless ramp composition matches.
Is sales productivity the same as sales activity?
No. Activity (calls, emails, meetings) is an input. Productivity is the revenue those activities produce. Rising activity with flat revenue means productivity is falling.
How does ramp affect productivity measurement?
Heavily. Raw revenue per rep punishes hiring-phase teams because ramping reps drag the average. Tenure-adjusted productivity separates engine health from hiring composition.
What is the fastest way to improve sales productivity?
Recover selling time: cut admin and meeting load, then tighten pipeline qualification. Both pay back within a quarter, before structural fixes like territory redesign land.
How is sales productivity different from sales efficiency?
Productivity is output per input unit (per rep, per hour). Efficiency is output per dollar of cost. A team can be productive but inefficient if its cost base is heavy.
Productivity is the quiet lever behind efficient growth: you can hire your way to revenue, or you can get more from the team you have, and the second is almost always cheaper. See the full sales capacity planning guide, or book a demo to see your team’s tenure-adjusted productivity computed live.