Reps spend less of their week selling than anyone wants to admit. The rest goes to admin, research, scheduling, and updating the CRM, and the cost compounds: The Bridge Group’s 2024 SaaS AE Metrics Report (n=419 SaaS companies) found average AE attainment of just 51% in 2024, down from 66% in 2022. Teams are busier than ever and producing less per head, which is precisely the gap sales productivity tools promise to close.
The catch is that they are not all solving the same problem. Some drive activity, some surface intelligence, some remove friction, and a few measure whether any of it actually turned into revenue. Here are the 12 worth knowing in 2026, grouped by the job they really do, plus how to buy for the bottleneck you actually have.
Start with a selling-time audit
Before buying anything, spend one week measuring where rep hours actually go. The lightweight version: have each rep tag their calendar into four buckets, live selling (calls, demos, negotiations), pipeline generation (prospecting, sequences), admin (CRM, internal reporting, approvals), and internal time (meetings, training).
Most teams that run this audit find live selling under 30% of the week, admin over 20%, and at least one internal meeting nobody can justify.
The audit converts the tool conversation from vibes to arithmetic: if admin runs 12 hours per rep per week, a friction tool that returns a third of that is worth roughly four selling hours per rep, every week, forever, and you can price that against the subscription directly.
It also exposes when the answer is not a tool at all: required fields nobody uses, reports nobody reads, and standing meetings that should be a dashboard.
How we grouped them
Four jobs cover the category. Activity tools make reps do more (sequences, dialers, prospecting data). Intelligence tools make leaders see more (conversation capture, deal inspection). Friction tools give hours back (CRM updates, scheduling).
Measurement tools answer the question the other three beg: did productivity, revenue per rep, actually move? Most stacks over-invest in the first group and under-invest in the last, which is how teams end up with record activity and falling output.
Activity and engagement tools
1. Outreach
The category-defining sales engagement platform: sequenced outreach across email, calls, and tasks at volume. Best for outbound-heavy teams that want reps running consistent cadences. The honest limitation: it measures activity output, not revenue productivity, and an unmanaged Outreach instance generates noise as efficiently as pipeline.
2. Salesloft
Outreach’s closest rival, with strong cadence, dialer, and deal workflow capabilities in one place. A fit for teams that want engagement plus deal management without a second vendor. Same caveat as Outreach: cadence compliance is not productivity.
3. Apollo
Contact database plus engagement tooling in one product, priced for SMB and mid-market. The draw is consolidation: prospecting data and sequencing without two contracts. Data quality varies by segment and geography, so validate coverage on your ICP before committing.
4. LinkedIn Sales Navigator
The standard for social selling and prospect research, best treated as the top-of-funnel layer feeding your engagement tool. It improves targeting more than it improves throughput.
Intelligence and workflow tools
5. Gong
Conversation intelligence that records and analyzes calls to surface what actually moves deals. Strong for coaching, deal inspection, and grounding strategy in deal reality rather than rep summaries. It sharpens judgment; it does not, by itself, return selling hours.
6. Clari
Revenue platform for pipeline inspection and forecasting. Helps leaders see risk early and run a disciplined forecast cadence. Its productivity contribution is indirect: fewer surprises, better-allocated leadership attention.
7. Scratchpad
A fast workspace that cuts the friction of updating Salesforce. Reps keep pipeline current in seconds instead of avoiding it for days, which quietly improves every downstream number that depends on CRM hygiene. One of the highest ratio-of-value-to-price tools on this list.
8. Chili Piper
Scheduling and inbound routing that removes the back-and-forth of booking meetings. Small surface area, real recovered hours, and faster speed-to-lead on inbound.
CRM platforms
9. Salesforce Sales Cloud
The system of record most productivity tools plug into. Endlessly capable, and only as productive as its hygiene: a cluttered Salesforce instance is itself a productivity drag, which is why several tools on this list exist.
10. HubSpot Sales Hub
An easier CRM with engagement and reporting built in. Strong for SMB and mid-market teams that want one platform and fewer integrations to babysit.
Measurement and capacity
11. Mediafly (formerly InsightSquared)
Sales analytics and enablement reporting on pipeline, forecast, and rep performance. A reasonable analytics layer on top of the CRM for teams that want dashboards without building them.
12. Lative
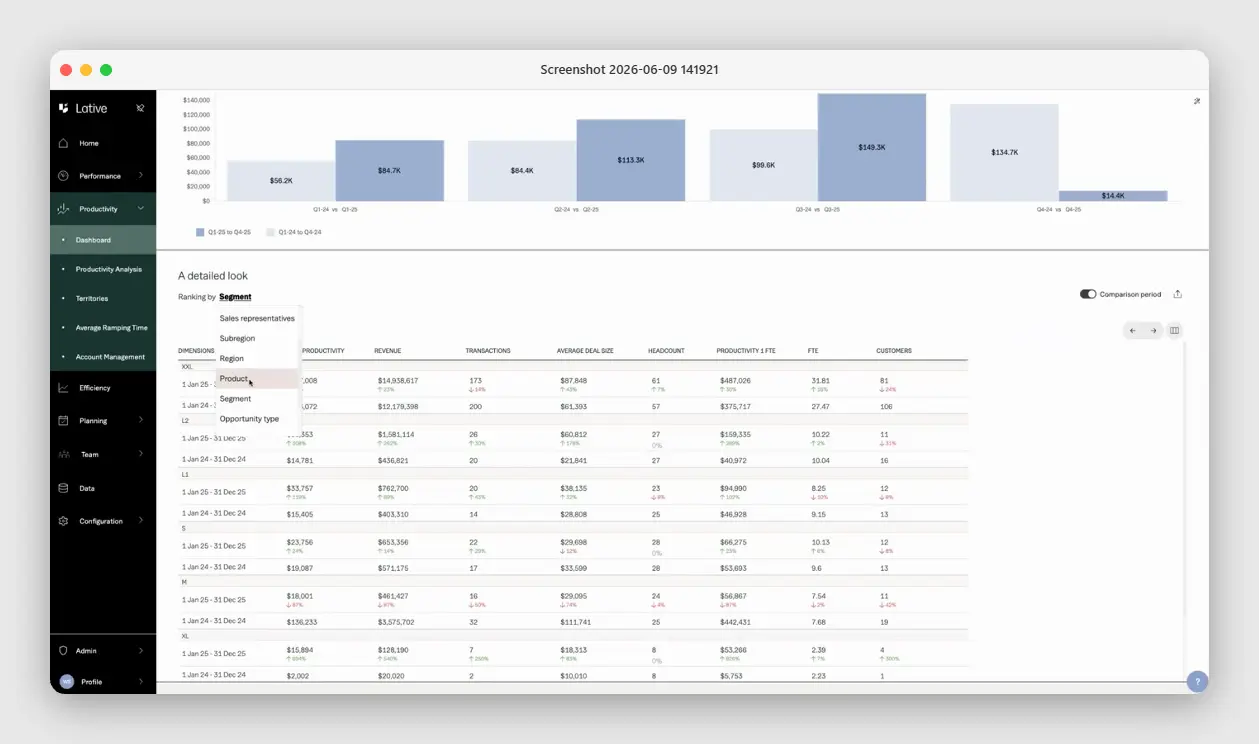
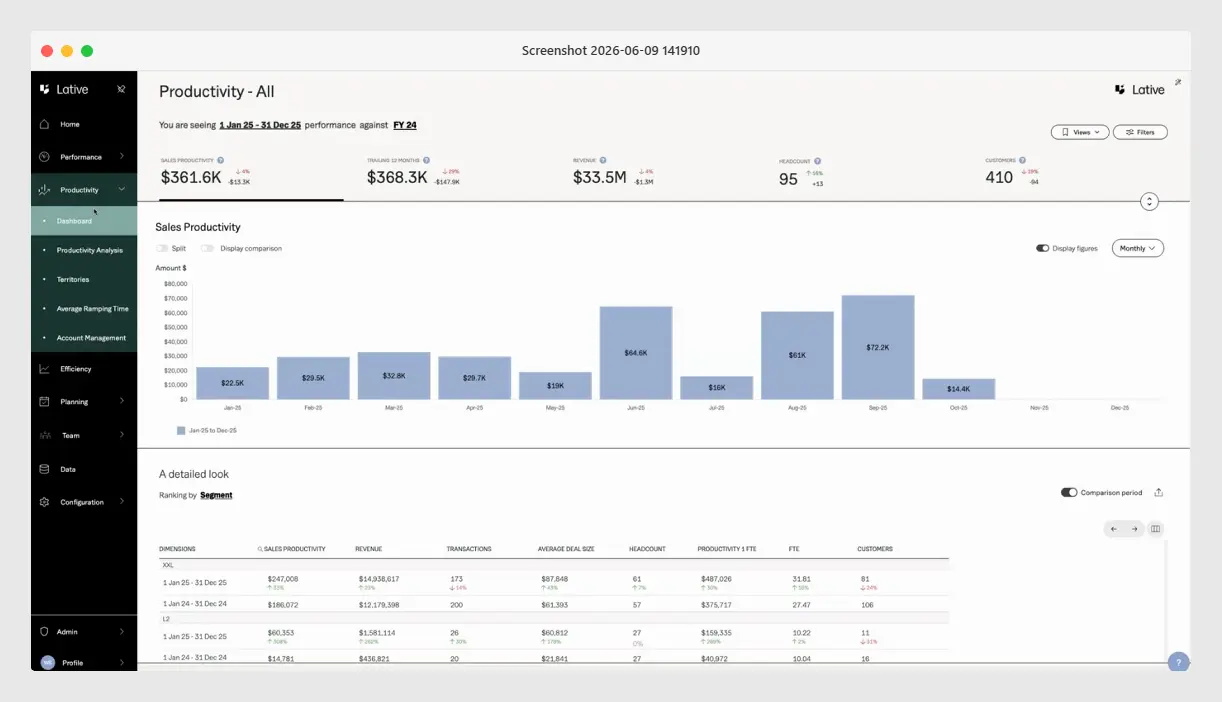
Most tools on this list drive or record activity. Lative measures whether that activity turns into productive capacity, the revenue each rep can realistically produce once ramp and territory are accounted for.
Its Productivity module computes production per rep and tenure-adjusted productivity from closed-won data, by segment, product, and opportunity type; Average Ramping Time shows how fast new hires actually reach full output; and the Efficiency view adds return per dollar of sales spend, by rep and segment.
It is the measurement layer, not an activity tool, and it pairs with the engagement tools above rather than replacing them: they generate the motion, Lative tells you what the motion produced.
How to buy for your bottleneck
- Outbound-heavy, pipeline-starved. Engagement (Outreach, Salesloft) plus prospecting data (Apollo, Sales Navigator). Add measurement early so activity gains are checked against revenue per rep.
- Complex deals, opaque pipeline. Conversation intelligence (Gong) and inspection (Clari), with Scratchpad to keep the CRM honest underneath.
- Admin-drowned reps. Friction killers first: Scratchpad and Chili Piper return hours this week, before any strategic tooling pays back.
- Scaling and efficiency-pressured. A measurement layer (Lative), so you know whether more activity is producing more revenue, and where the next dollar of productivity investment should go.
A worked example: pricing a productivity gain
Take a hypothetical eight-rep mid-market team at $750K average production per ramped rep, roughly $390 of revenue per selling hour if live selling runs 24 hours a week per rep. A friction stack (Scratchpad plus Chili Piper, call it $150 per rep per month) that returns three selling hours per rep per week is worth about $1,170 of weekly selling capacity per rep at historical conversion, against $35 a week of cost.
Even if only a fifth of recovered time converts to incremental production, the stack pays for itself several times over. Run the same math on an activity platform and the answer depends entirely on whether pipeline is the constraint, which is exactly what the measurement layer tells you.
Price every productivity tool this way: recovered hours or incremental production, against your own revenue per selling hour, not against the vendor’s case study.
The 90-day proof window
Give every new productivity tool a 90-day proof window with the success metric written down before rollout: recovered selling hours for friction tools, qualified pipeline per rep for activity tools, tenure-adjusted revenue per rep for the stack overall.
At day 90, the tool either moved its metric or it churns. Teams that skip this discipline accumulate overlapping subscriptions that each seemed reasonable alone, and the stack itself becomes the productivity drag, one more login, one more place to update, one more dashboard nobody reconciles.
Common buying mistakes
Stacking activity tools on a measurement gap. If you cannot see revenue per rep by tenure and segment, you cannot tell whether the new sequencer helped. Instrument first, then accelerate.
Confusing adoption with impact. High login counts are not productivity. The test is whether tenure-adjusted revenue per rep moved in the two quarters after rollout.
Ignoring the data substrate. Every intelligence and measurement tool inherits CRM quality. Stage hygiene and clean close dates are the cheapest productivity investment on this list.
Buying tools instead of removing work. The fastest productivity gain is usually subtraction: fewer required fields, fewer internal meetings, fewer reports. Tools that remove work beat tools that add workflows.
Frequently asked
What are sales productivity tools?
Software that increases revenue output per rep, by driving activity, surfacing deal intelligence, removing administrative friction, or measuring whether output per rep is actually improving.
What is the difference between activity and productivity?
Activity is input: calls, emails, meetings. Productivity is output per input: revenue per rep, per selling hour. Rising activity with flat revenue means productivity is falling. See what is sales productivity.
Which productivity tool should a team buy first?
The one that fixes the current bottleneck: friction killers for admin-drowned teams, engagement for pipeline-starved ones, and a measurement layer as soon as headcount makes intuition unreliable.
How do you measure whether productivity tools work?
Tenure-adjusted revenue per rep, trended across the quarters before and after rollout. Tool-level metrics (sequences sent, calls logged) measure usage, not value.
Do productivity tools replace capacity planning?
No. Tools raise output per rep; capacity planning determines whether the roster can hit the target at all. Strong teams run both.
More tools do not equal more productivity. Buy for the bottleneck you actually have, instrument the result, and let revenue per rep, not feature lists, decide what stays. See the full sales capacity planning guide, or book a demo to see tenure-adjusted productivity measured live.