Most sales forecasts are wrong, and everyone in the room knows it. RepVue’s Q2 2025 Cloud Sales Index, covering roughly 47,000 quota-carrying reps across 246 cloud companies, found 57.31% missed quota that quarter, which tells you how much faith to put in numbers built from optimistic rep commits.
A good forecasting process does not remove uncertainty. It makes the number defensible: derived from data, checked against capacity, and re-run as conditions change.
This guide covers what sales forecasting is, how it differs from the targets and quotas it gets confused with, the five main methods and when each works, a worked example of the most common failure, and the process discipline that separates teams that trust their number from teams that argue about it.
Sales forecasting, defined
Sales forecasting is the practice of predicting future revenue over a set period, usually a month, quarter, or year. It takes pipeline, historical performance, and team capacity and turns them into a number leadership can plan, hire, and spend against.
A forecast is not a goal. The goal is what you want to happen; the forecast is your honest estimate of what will happen given what you can see today. It is also not a quota: the quota is the target a rep owns, while the forecast is the company’s estimate of what will actually close.
And it is not capacity: capacity is what the team is structurally able to produce, while the forecast is what this period’s pipeline should yield. Keeping the four numbers separate, goal, quota, capacity, forecast, is half the discipline; most forecasting arguments are really definition arguments in disguise.
The five main sales forecasting methods
- Stage-weighted pipeline. Weight each open deal by its stage probability and sum. Fast and CRM-native, but only as honest as your stage hygiene: probabilities inherited from CRM defaults or rep optimism produce a confident version of a wrong number. Derive stage weights from your own trailing conversion data, not the defaults.
- Historical projection. Project forward from past performance and growth rates. Cheap and reasonable for stable, repeatable businesses; dangerous in any quarter where the team, the market, or the motion changed, which in SaaS is most quarters.
- Capacity-based bottom-up. Build the number from rep capacity, ramp position, and trailing attainment, the math in how to calculate sales capacity. The most reliable method for scaling teams because it ties the forecast to who is actually carrying quota, and the only method that catches staffing-driven misses before they happen.
- Top-down allocation. Start from a market or board target and work backward. Useful for ambition-setting, not for committing numbers; the full comparison is in top-down vs bottom-up sales forecasting.
- AI and predictive models. Models trained on deal signals, activity data, and historical outcomes call the number and flag at-risk deals. They genuinely help, with one hard constraint: a model trained on dirty stage data automates the dirt. Data quality is the precondition, not a nice-to-have.
Strong teams blend two or three. The highest-value pairing is stage-weighted pipeline checked against a capacity-based bottom-up, because each catches the failure mode the other misses: the pipeline view spots demand problems, the capacity view spots staffing problems.
A worked example: the capacity check that saves the quarter
A hypothetical team carries $4M of stage-weighted pipeline against a $3M quarterly target. The CRM says 1.33x weighted coverage; the pipeline-only forecast says covered, commit it.
The capacity check says otherwise. Of six reps, two ramped in the last ninety days and sit at roughly 40% productivity on the cohort curve. Ramp-adjusted capacity: four reps at $600K of realistic quarterly production ($2.4M) plus two at $240K ($480K), about $2.88M.
The honest forecast is not $3M+; it is $2.6M to $2.9M depending on conversion, because the team physically cannot work the pipeline a six-ramped-rep model assumes. The pipeline looked fine. The capacity did not. Quarter after quarter, this single mismatch, demand coverage without supply coverage, is the most common reason forecasts miss high.
Forecast categories: commit, best case, and pipeline
Most mature teams report the forecast in three tiers rather than one number. Commit is the floor: deals with verified buying process, paper in motion, and a close date the buyer has confirmed, the number leadership can spend against. Best case adds deals that are real but carry one open risk, an unsigned security review, an unconfirmed budget holder. Pipeline is everything else that is qualified but early.
The tiers matter because they make disagreement specific: when sales calls $2.8M commit and finance models $2.4M, the conversation goes deal by deal through the commit list instead of trading vibes. Tier definitions should be written, audited quarterly, and enforced in the CRM, because the moment “commit” means different things to different managers, the roll-up means nothing at all.
Why forecasts miss
- Dirty CRM data. Inflated stages, stale close dates, and zombie deals make every downstream calculation confident and wrong.
- Pipeline-only logic. Forecasting demand without checking the capacity to serve it, the worked example above, misses high in exactly the quarters that matter most, the ones with heavy hiring.
- Happy-ears commits. Rep-submitted numbers skew optimistic under quota pressure. Pressure-test commits against stage history: a rep whose commits land at 70% should have their commit weighted accordingly, mechanically, not personally.
- Static cadence. A forecast set at quarter open and reviewed at quarter close is a historical document. Deals move weekly; the forecast should too.
- Blended segments. One conversion rate across SMB and enterprise misforecasts both. Segment-level rates are not optional once you sell into more than one motion.
How to improve forecast accuracy
Four moves, in order of impact. First, connect the forecast to capacity: every forecast review should show the capacity number next to the pipeline number, and any forecast above capacity gets challenged by default. Teams with this RevOps discipline outperform: the Ebsta x Pavilion 2024 analysis of 4.2 million opportunities found RevOps-driven planning correlated with 87% higher win rates and 21% shorter cycles.
Second, derive stage weights from trailing actuals by segment and refresh them quarterly. Third, run the forecast weekly with a fixed agenda: what changed, which deals moved, what does the capacity side say.
Fourth, track your own accuracy: log the week-one forecast against the quarter-end actual, by segment and by forecaster, and feed the bias back into the weights. Teams aiming for forecasts within 5 to 10% of actuals get there by measuring their own error, not by buying better dashboards first.
Forecasting cadence and ownership
The forecast needs an owner and a rhythm. In most scaling SaaS companies, RevOps owns the model and the data hygiene, sales leadership owns the commit, and finance owns the reconciliation to the plan. Weekly is the right cadence for the operating forecast, with a deeper monthly pass that re-checks the capacity inputs: hires landed or slipped, ramp on or off curve, attainment drift.
The monthly pass is where forecasting connects back to the capacity model, and skipping it is how teams end up forecasting a roster that no longer exists.
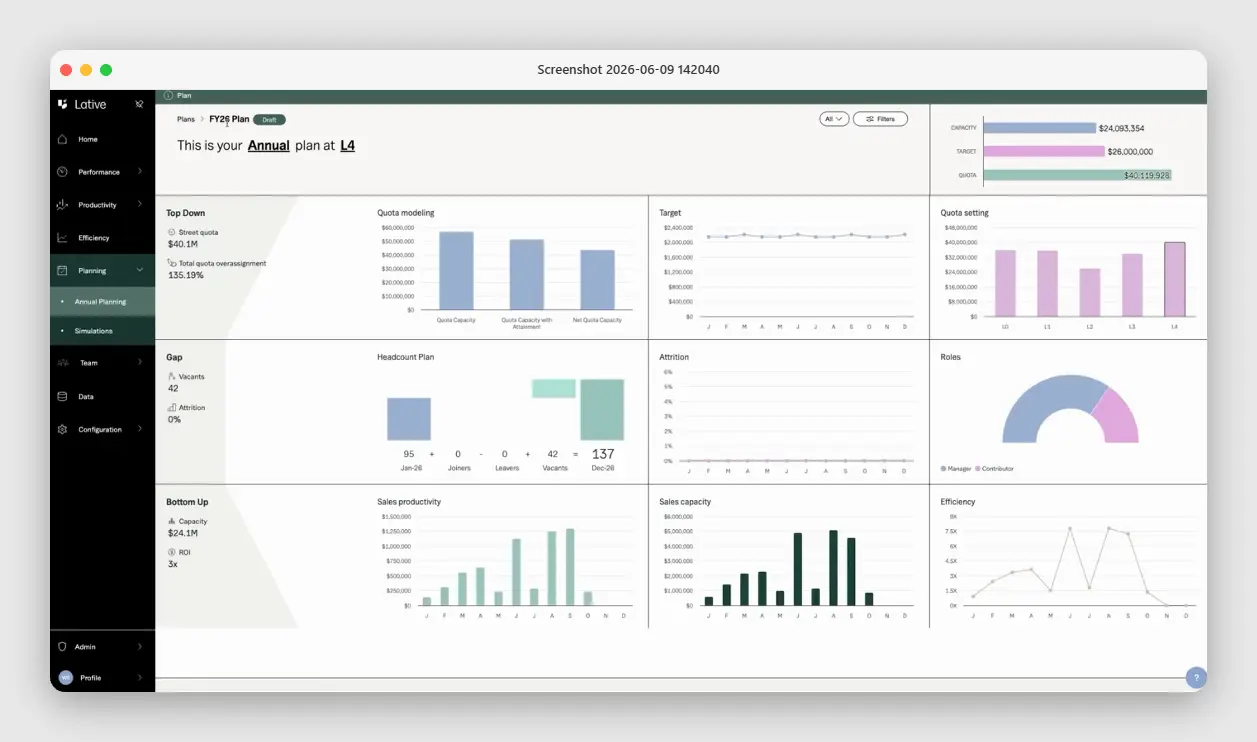
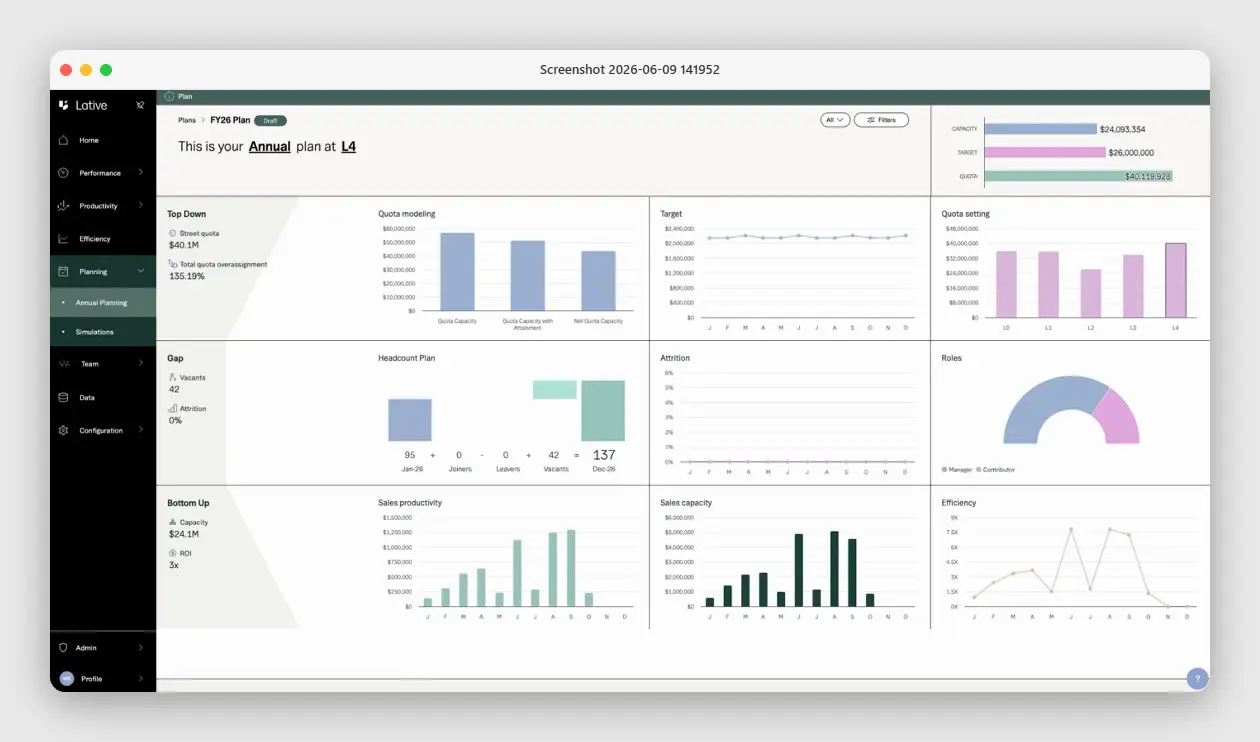
How Lative connects the forecast to capacity
The capacity check most teams skip is the one Lative runs natively.
Its Productivity module establishes per-rep production from closed-won data, tenure-adjusted and segmented; Average Ramping Time keeps ramp curves honest from real cohorts; and the Annual Planning view holds the forecast, the capacity number, the target, and the quota on one screen, so a forecast that exceeds what the roster can deliver is visible the moment it happens, not at the post-mortem.
When hiring slips or a rep resigns, the capacity side updates immediately and the forecast conversation adjusts the same week. The Simulations view extends this into what-ifs: what does the number look like if the two Q2 hires land in Q3, or if ramp compresses by six weeks.
Key takeaways
- A forecast is not a goal, a quota, or capacity; most forecasting arguments are definition arguments in disguise.
- The most reliable method is capacity-based bottom-up, checked against stage-weighted pipeline.
- Forecasts miss high when demand is covered but ramp-adjusted capacity is not.
- Run it weekly, segment the conversion rates, and measure your own error to improve.
Frequently asked
What is sales forecasting?
The practice of predicting future revenue over a set period using pipeline, historical performance, and team capacity, producing a number leadership can plan and hire against.
What is a good forecast accuracy?
Many teams target within 5 to 10% of actuals. Most fall short, usually because the forecast ignores capacity and ramp. Measure your own error by segment and improve from there.
How often should you forecast?
Weekly for the operating forecast, monthly for the deeper pass that re-validates capacity inputs. A once-a-quarter forecast is stale within weeks.
What is the difference between a forecast and a quota?
A quota is the target a rep owns. A forecast is the company’s honest estimate of what will actually close. Confusing them turns forecasting into negotiation.
Which forecasting method is most accurate?
For scaling teams, a capacity-based bottom-up checked against stage-weighted pipeline beats either alone, because one catches staffing problems and the other catches demand problems.
What data does a sales forecast need?
Clean stage and close-date data, trailing conversion rates by segment, the rep roster with ramp positions, and trailing attainment. The forecast inherits the quality of all four.
A forecast is only useful if you trust it enough to hire and plan against it. Build it from capacity, check it against pipeline, re-run it weekly, and measure your own error. Compare dedicated tools in the sales forecasting software roundup, or book a demo to see a capacity-checked forecast on your own data.