Top-down vs bottom-up sales forecasting is the choice between starting from a market target and working down, or starting from rep capacity and pipeline and working up. Most companies pick one by default, usually top-down because it is faster, and pay for it at quarter end.
RepVue’s Q2 2025 Cloud Sales Index (roughly 47,000 reps, 246 companies) found 57.31% of SaaS reps missed quota, and a large share of those misses trace to numbers that were assigned downward without ever being validated against what the team could produce.
This guide covers how each method actually works, a worked example showing where they diverge, when to use which, and the reconciliation process that turns two conflicting numbers into a plan. The strongest forecasts are not one or the other. They are both, reconciled.
Top-down forecasting: how it works
Top-down starts from a high-level number and divides it into team and rep targets. The sequence:
- Set the anchor. A board revenue target, a market-share ambition, or last year’s number times a growth rate.
- Allocate to segments. Split the anchor across segments or regions, usually proportional to last year’s contribution.
- Divide to reps. Segment target divided by headcount becomes the per-rep quota.
The strengths are real: it is fast, it aligns cleanly with the investor model, and it sets ambition before the team negotiates it down. The weakness is structural: nothing in the process checks whether the team can produce the number. Ramp, territory quality, attainment history, and segment mix never enter the math. Top-down is a statement of intent wearing the costume of a forecast.
Bottom-up forecasting: how it works
Bottom-up builds the number from the ground:
- Start with the roster. Every quota-carrying rep, their segment, their hire date, and their position on the ramp curve.
- Apply real productivity. Each ramped rep contributes quota times trailing attainment; each ramping rep contributes a cohort-based fraction. This is the productive capacity calculation.
- Check the pipeline. Apply segment win rates to open pipeline to confirm the demand side can feed the capacity. A team with capacity but no pipeline coverage still misses.
- Sum to the total. The roll-up is the revenue the business can defensibly commit.
The strength is accuracy: the number reflects who is actually selling and how they actually perform. The discipline pays measurably. The Ebsta x Pavilion 2024 analysis of 4.2 million opportunities found teams running RevOps-driven planning achieved 87% higher win rates and 21% shorter cycles than peers.
The weakness: built alone, bottom-up can lack ambition, because it projects forward from current performance and nobody ever stretched a business by extrapolating it.
A worked example: where the two diverge
Take a hypothetical company, eight reps, a board that wants $8M next year.
Top-down says: $8M divided by eight reps is a clean $1M quota each. Done by lunch.
Bottom-up says: six ramped reps at 70% trailing attainment on $1M quotas contribute $4.2M. Two reps hired in Q4 sit mid-ramp and contribute roughly $600K combined. Three territories were carved thin last year and their reps have never exceeded 55% attainment, which the trailing average already reflects. Realistic capacity: $4.8M, plus whatever a strong pipeline quarter adds, call it $5.5M with favorable conversion.
The divergence is $2.5M, roughly 31% of the target, and it is the most important number in the planning cycle. Top-down alone would have distributed it invisibly across eight quotas and called the resulting misses a performance problem. Bottom-up alone would have anchored the company to $5.5M and left growth on the table. Reconciliation puts the $2.5M on the table in January, where it can still be closed.
Choosing the top-down anchor
Not all top-down anchors are equally honest. Last year times a growth rate is the most common and the most fragile, because it assumes the conditions that produced last year still hold. A market-sizing anchor (share of serviceable market) is better for new segments where there is no history to extrapolate.
An investor-model anchor is the most dangerous: it describes what the cap table needs, not what the market offers, and it is the anchor most likely to produce quotas nobody can hit. Whichever anchor you use, label it in the plan so the reconciliation conversation starts from what the number actually represents.
When to use each
- Top-down: early planning, setting ambition, board and investor conversations, sizing what the market should allow.
- Bottom-up: committing a forecast, setting quotas, staffing and hiring decisions, anything where being wrong has a payroll cost.
- Both, reconciled: the annual plan, every reforecast, and any quarter where the two numbers disagree by more than 10%.
How to reconcile the two numbers
Reconciliation is the actual work of forecasting, and it has a sequence:
- Run both independently. If the bottom-up team knows the top-down answer first, the model gets quietly tuned to match it and the exercise is theater.
- Quantify the gap in dollars and months. A $2.5M gap found in January is a plan. The same gap found in September is a miss.
- Assign the gap to levers. Hiring (slowest, surest), productivity and ramp compression, pipeline volume, conversion improvement, or a target reset. Each lever gets an owner and a date.
- Re-run monthly. Hires slip, reps resign, win rates move. A reconciliation done once a year is stale by Q2, which is the single most common forecasting failure.
The reconciliation calendar
Reconciliation is not a single event. Across a planning year it runs in four passes. In October, run both models independently and present the gap to the executive team as a fact with options attached. In December, lock the plan with the gap-closing levers named, owned, and dated, and set quotas from the bottom-up capacity number rather than the top-down anchor.
At the start of each quarter, re-run the bottom-up model on trailing actuals and check whether the levers are delivering: did the Q1 hires land, did ramp hold, did the win-rate program move the number?
And monthly, refresh the capacity inputs and flag any drift above two points on attainment or two weeks on hiring. Teams that run this calendar find their misses in the model before they find them in the CRM, which is the entire point of forecasting twice.
Common mistakes
Letting the target edit the model. When the bottom-up number disappoints, the temptation is to raise the attainment assumption until it matches. That is not reconciliation; it is forgery with extra steps.
Forecasting pipeline without capacity. A $9M weighted pipeline against a $3M target looks like 3x coverage, but if a third of the team is mid-ramp, the deals cannot all be worked. Pipeline answers demand; capacity answers supply; the forecast needs both.
Blending segments. One average across SMB and enterprise produces a forecast that is wrong for both. Win rates, cycles, and ramp all differ by segment, and so should the model.
Treating the divergence as a dispute. The gap between top-down and bottom-up is not finance versus sales. It is information, the size of the problem the plan must solve, and the teams that treat it that way plan better than the ones that negotiate it away.
How Lative reconciles both on one screen
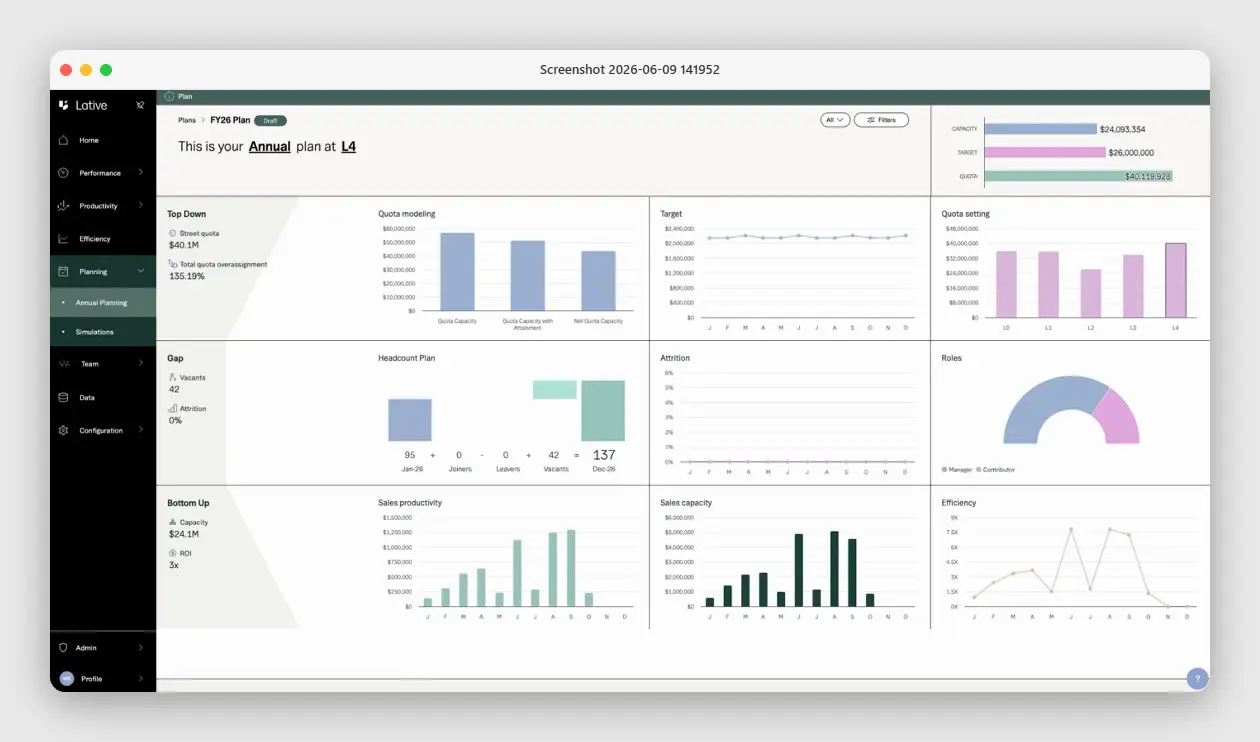
The reconciliation most teams run across three spreadsheets is what Lative’s Annual Planning view does natively: top-down quota and target on top, bottom-up productivity and capacity beneath, and the gap, with the headcount, attrition, and roles that drive it, in between.
The bottom-up side is fed by the Productivity module (production per rep by segment, tenure-adjusted) and Average Ramping Time (ramp curves from real hire cohorts), so the capacity number updates as the business moves instead of waiting for the next planning cycle.
The Quota Modeling view then rolls ramp, seasonality, and attrition into net quota capacity by role, so the quota you assign downward is one the roster can actually deliver. When the two numbers diverge mid-year, you see it the week it happens.
FAQ
Which is more accurate, top-down or bottom-up forecasting?
Bottom-up, for any team past founder-led selling, because it ties the forecast to real rep capacity, ramp, and attainment. Top-down is faster and useful for setting ambition, not for committing numbers.
Should you use both methods together?
Yes. Set ambition top-down, validate it bottom-up, and treat the gap between the two as the plan to close, with named levers and owners.
Why do top-down forecasts miss so often?
Because dividing a target by headcount ignores ramp, territory quality, attainment history, and segment mix. The number is assigned, not derived, so reality has no vote until quarter end.
How often should the reconciliation be re-run?
Monthly. Hiring slips, attrition, and conversion shifts move the bottom-up number continuously, and a gap caught early is a gap you can still close.
What if the bottom-up number is far below the board target?
That gap is the plan. Size it, assign it to levers (hiring, productivity, pipeline, conversion, or a target conversation), and track lever progress weekly. Hiding the gap inside quotas just converts it into next quarter’s attainment miss.
For the methods underneath each model, see what is sales forecasting, or compare tools in the sales forecasting software roundup. To see your own top-down and bottom-up numbers reconciled on one screen, book a demo.