Sales analytics should answer one question: where is revenue won and lost, and what do we do about it. Most tools answer only the first half, which is why so many teams are drowning in dashboards while attainment falls.
The Bridge Group’s 2024 SaaS AE Metrics Report (n=419 SaaS companies) found average AE attainment dropped to 51% in 2024 from 66% in 2022, a decline that happened in full view of more reporting than the industry has ever had. Charts are not decisions.
The market splits three ways: general BI you build yourself, sales-specific intelligence that ships with the logic included, and analytics tied to capacity so the numbers lead to staffing and quota decisions. Here are the 12 sales analytics software tools worth knowing in 2026, what each is actually for, and how to choose.
How we evaluated
Four criteria separate analytics that change decisions from analytics that decorate decks. Decision proximity: does the output map to an action, hire, rebalance, requalify, or just describe the past?
Sales-native objects: does the tool understand quota, ramp, segment, and cohort natively, or do you rebuild those concepts in every query? Data freshness: continuous CRM sync versus scheduled exports. And maintenance load: who keeps it accurate after the analyst who built it leaves?
The 12 best sales analytics tools in 2026
1. Salesforce CRM Analytics
Native analytics over Salesforce data, formerly Tableau CRM. Deep, flexible, and adjacent to the system of record, with prebuilt sales apps. The cost is build-and-maintain effort: it rewards teams with a dedicated admin or analyst and punishes those without.
2. Tableau
The reference standard for visualization over any data source. If you can model it, Tableau can show it beautifully. The sales logic, attainment by cohort, ramp curves, coverage by segment, is yours to construct, which makes it as good as your data team and no better.
3. Microsoft Power BI
The Microsoft-stack BI standard: capable, cost-effective, and everywhere. Same trade as Tableau: a general engine that knows nothing about sales until someone teaches it.
4. Looker
Modeling-first BI from Google Cloud, built around a governed semantic layer. Strong for teams that want one definition of “pipeline” across every dashboard. Requires real modeling investment up front.
5. Gong
Analytics built on conversation data: what is actually said in deals, not what reps log. Excellent for coaching, deal risk, and grounding strategy in reality. It analyzes the conversation layer, not the capacity layer.
6. Clari
Revenue analytics for pipeline and forecast, with deal-level risk flagged automatically. Strong operating cadence tooling for the weekly forecast. Its lens is this quarter’s pipeline, not next year’s capacity architecture.
7. BoostUp
Deal and pipeline analytics with configurable forecasting, a common Clari alternative for mid-market and enterprise revenue teams that want deeper inspection control.
8. Mediafly (formerly InsightSquared)
Purpose-built sales analytics covering pipeline, forecast, and rep performance, dashboards included rather than built. Good for teams that want sales reporting without a BI project.
9. Aviso
AI-driven revenue analytics and forecasting for enterprise teams with complex pipelines. The models are only as good as the stage hygiene feeding them, which is true of every AI tool on this list and decisive for this one.
10. HubSpot Reporting
Built-in dashboards for teams on HubSpot: clean, fast, and zero-setup for SMB and mid-market. It reports what HubSpot knows; deeper cohort and capacity analysis lives elsewhere.
11. Salesforce Reports and Dashboards
The native reporting every Salesforce team starts with. Fine for operational lists and simple roll-ups, limited for trend, cohort, and capacity analysis, which is where most teams outgrow it.
12. Lative
General BI tells you what happened. Lative connects sales analytics to capacity, so a dip in attainment resolves into a specific cause and a specific response.
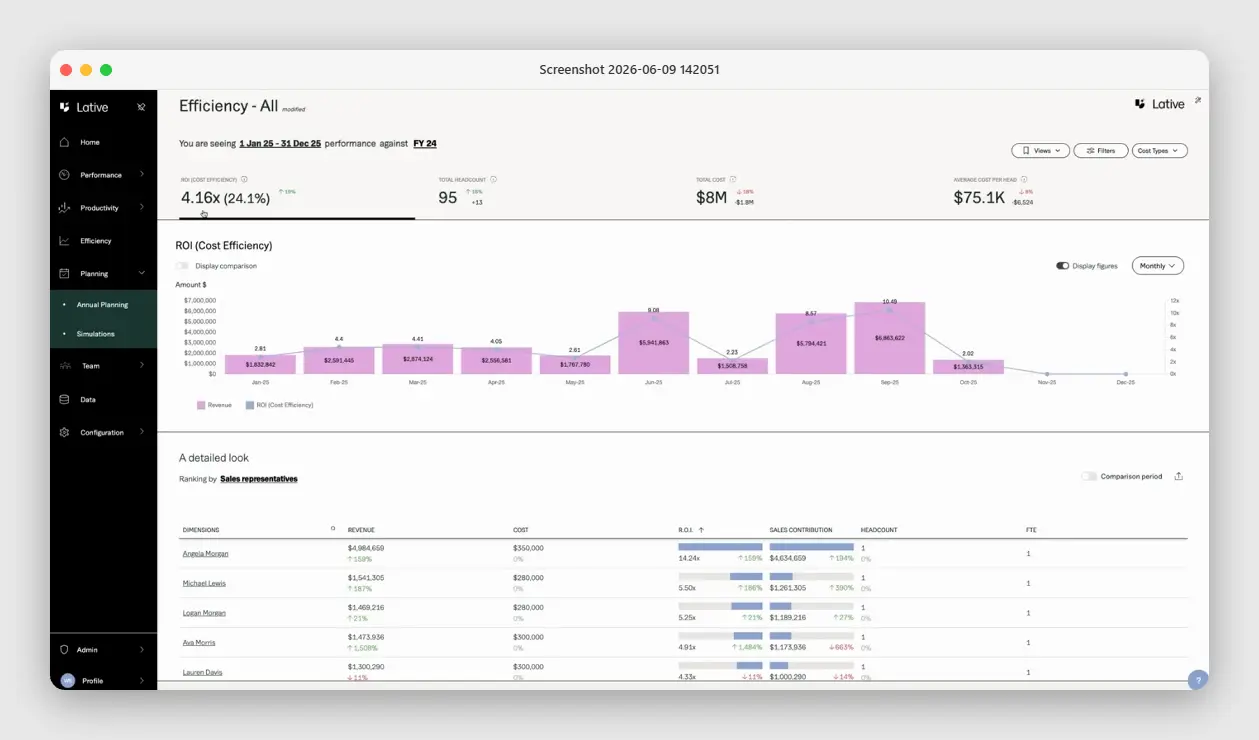
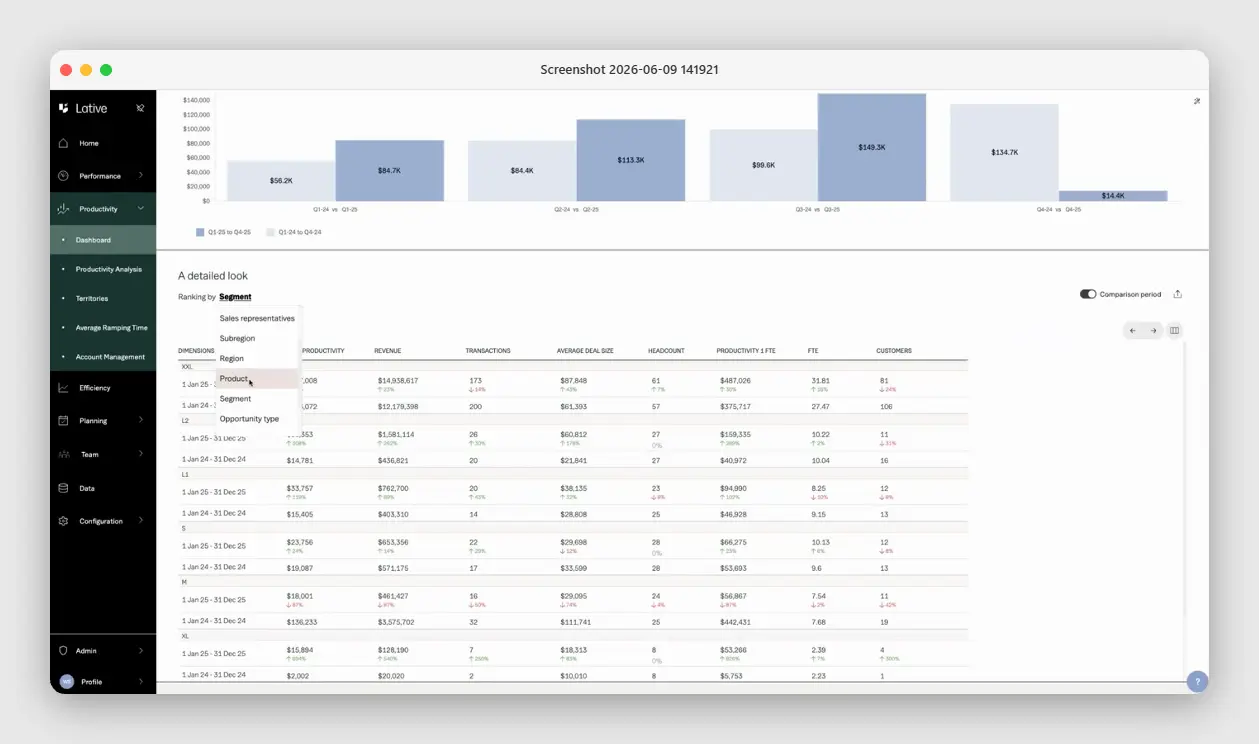
Its Productivity module breaks production down by rep, region, product line, segment, and opportunity type, tenure-adjusted so ramping reps read fairly; the Efficiency view shows return per dollar of sales spend by rep and segment; and because the same model feeds Capacity and Annual Planning, the analytics terminate in decisions: pipeline problem or staffing problem, rebalance or hire, requalify or reset the target.
It is not a build-it-yourself BI canvas; it is the sales planning analytics layer, and it pairs with rather than replaces the conversation and pipeline tools above.
How to pick
- You need flexible BI across many sources. Tableau, Power BI, or Looker, plus an analyst who owns the sales data model.
- You want sales intelligence out of the box. Gong for conversations, Clari or BoostUp for pipeline, Mediafly for packaged reporting.
- You need analytics that end in staffing and quota decisions. Lative, so the numbers connect to capacity and the meeting ends with an action, not a follow-up data pull.
The five questions a sales analytics stack must answer weekly
Whatever you buy, the test is whether leadership can answer these five questions every Monday without a data pull. Where does attainment stand, by segment and cohort, against pace? Which segments are under-covered on pipeline, and is the cause volume or conversion? How is tenured productivity trending, separate from hiring mix?
Are the current ramp cohorts on or off their curve, and what does that do to the quarter? And what did last week’s forecast say versus what actually happened? A stack that answers all five is complete regardless of logo count; a stack that answers none of them is expensive decoration regardless of how many dashboards it renders. Write the five questions into the evaluation scorecard and score every demo against them.
A worked example: the same dip, three readings
A hypothetical team’s bookings fall 12% quarter over quarter. The BI dashboard shows the drop by region and product, accurately, and stops. The pipeline tool shows coverage fell to 2.1x in mid-market and flags three slipping deals. The capacity layer shows the real chain: two January hires are running eight weeks behind the ramp curve, tenured productivity is flat, and ramp-adjusted capacity, not demand, explains the miss.
Three tools, three readings, one of them actionable: protect the cohort, fix onboarding, and stop burning pipeline spend on a supply problem. The lesson is not that BI is wrong; it is that without the capacity lens, every dip defaults to a demand diagnosis, and the most expensive misdiagnosis in sales is treating a staffing problem with a marketing budget.
Build vs buy, honestly
The build-on-BI path makes sense under two conditions: a dedicated analyst who owns the sales data model as a real job, and stable definitions that have survived at least one planning cycle. Without both, packaged sales analytics win on total cost, because the hidden price of BI is not the license, it is the quiet decay of every dashboard after its author moves on.
A reasonable middle path for scaling teams: packaged tools for the operating cadence (forecast, pipeline, capacity) and BI reserved for ad hoc investigation, where decay does not matter because nothing depends on last quarter’s workbook.
Common buying mistakes
Buying dashboards for an undefined question. Decide the five questions leadership must answer weekly, then buy whatever answers them. Generic dashboards multiply; questions discipline.
Ignoring the maintenance owner. Every BI build decays without an owner. If no one owns the semantic layer, packaged sales analytics beat a beautiful abandoned Tableau workspace.
Analytics on dirty stages. Cohort and conversion analysis inherit CRM hygiene. Fix stage definitions first or every tool on this list will confidently mislead you.
Stopping at description. If quarterly reviews end with “interesting, let’s pull more data,” the stack is missing the decision layer, usually the capacity connection, not another chart type.
Frequently asked
What is sales analytics software?
Software that turns sales data, pipeline, activity, conversations, outcomes, into analysis of where revenue is won and lost, ranging from general BI to sales-native intelligence and capacity-connected planning analytics.
What is the difference between BI and sales analytics tools?
BI (Tableau, Power BI, Looker) is a general engine you teach about sales. Sales-native tools ship with quota, pipeline, and cohort logic included. Capacity-connected tools add the staffing and planning lens.
What metrics should sales analytics track?
Attainment and its distribution, stage conversion and cycle length by segment, pipeline coverage, tenure-adjusted productivity per rep, and capacity utilization. See what is sales productivity for the measurement logic.
Do AI analytics tools improve sales performance?
They improve detection, risk flags and anomalies surface earlier. Performance improves when the analytics connect to decisions: staffing, territory, quota, and pipeline actions.
When should a team add a capacity analytics layer?
Once headcount and segments make intuition unreliable, typically past 15 to 20 reps, or the first time a bookings dip cannot be explained as demand versus staffing. See how to calculate sales capacity.
The best analytics tool is the one your team acts on. Match it to the decision you need to make, and make sure at least one layer of the stack can tell a demand problem from a staffing one. See the full sales capacity planning guide, or book a demo to see capacity-connected analytics live.