You hired the reps and hit the headcount target. So why is the revenue gap still there? It’s a question most sales leaders eventually ask, usually mid-quarter, usually too late to fix.
The answer almost always comes back to the same problem. Your capacity model is built on headcount, not productivity. And those two things are not the same.
I’m breaking down why the standard capacity formula keeps failing revenue teams, what a productivity-based model actually looks like, and how to build one that accounts for ramp time, attrition, and the admin load quietly eating your quota attainment.
By the end, you’ll have a clearer picture of the inputs your plan is probably missing and what to do about them.
The model most teams are using
Walk into almost any RevOps or finance planning session, and you’ll see a version of this formula:
Revenue target / average quota = number of reps needed.
It’s clean and fits neatly into a spreadsheet. And it’s unfortunately wrong.
Not wrong in a theoretical sense. Wrong in the sense that it consistently produces headcount plans that miss the mark, and then teams spend the rest of the year wondering why.
The formula assumes every rep on your roster is a fully productive selling machine. They’re not. Some are three months into their ramp. Some are one foot out the door. Some are spending more time updating Salesforce than talking to prospects.
According to Salesforce’s State of Sales report (2024), sales reps spend just 28% of their working week on actual selling activities. The other 72% goes to admin, data entry, CRM updates, and internal meetings.
Your model almost certainly isn’t accounting for that.
What ramp periods actually cost you
Here’s where it gets expensive.
Research from The Bridge Group (2024) found that even top-performing AEs take an average of 5.7 months to reach quota. For nearly half of organisations, new reps take more than five months to get to full productivity.
During that window, you’re paying full compensation for partial output.
Now multiply that across every new hire in your plan. If you modelled those seats as fully productive from day one, you’ve overstated your capacity by a significant margin before the quarter even starts.
The cost compounds quickly. Ramp time is estimated to cost up to three times a rep’s base salary when you factor in training, lost productivity, and missed revenue.
Don’t confuse this for a rounding error when it’s a structural gap in your plan.
The quota attainment problem nobody likes to talk about
Let’s say your reps are ramped. How many of them are actually hitting quota?
RepVue’s Q4 2024 Cloud Sales Index puts average quota attainment across SaaS at 43%. QuotaPath’s 2024 Compensation Trends report found that 91% of sales teams failed to hit quota expectations for the year.
Think about what that means for your capacity model.
If you’re planning on 100% quota attainment across your team, you’re not building a capacity plan. You’re building a wish list.
According to most sales compensation analysts, the standard benchmark is to have 80% of your reps hit quota in a given period. That’s healthy. If everyone’s hitting it, your quotas are too low. If fewer than half are hitting it, something is structurally broken.
Either way, your headcount model needs to account for the realistic distribution, not the optimistic one.
Stripe's over-hiring problem is a case study in this
In November 2022, Stripe cut 14% of its workforce, roughly 1,100 people, and CEO Patrick Collison published a remarkably candid memo admitting the company had made two consequential mistakes. One was misjudging near-term growth. The other was letting operating costs, including headcount, grow too fast.
His exact words: “We over-hired for the world we’re in.”
Stripe isn’t a company that lacked sophistication. Their revenue and payment volume had grown more than 3x in the preceding years. They had the data. What they didn’t have was a planning model that connected headcount to productive capacity rather than projected growth curves.
The gap between the two only became visible when the external conditions shifted. By then the cost was already locked in.
What a productivity-based model actually looks at
The better approach starts with a different question. Not ‘how many reps do we need?’ but ‘how much productive selling capacity do we actually have right now?’
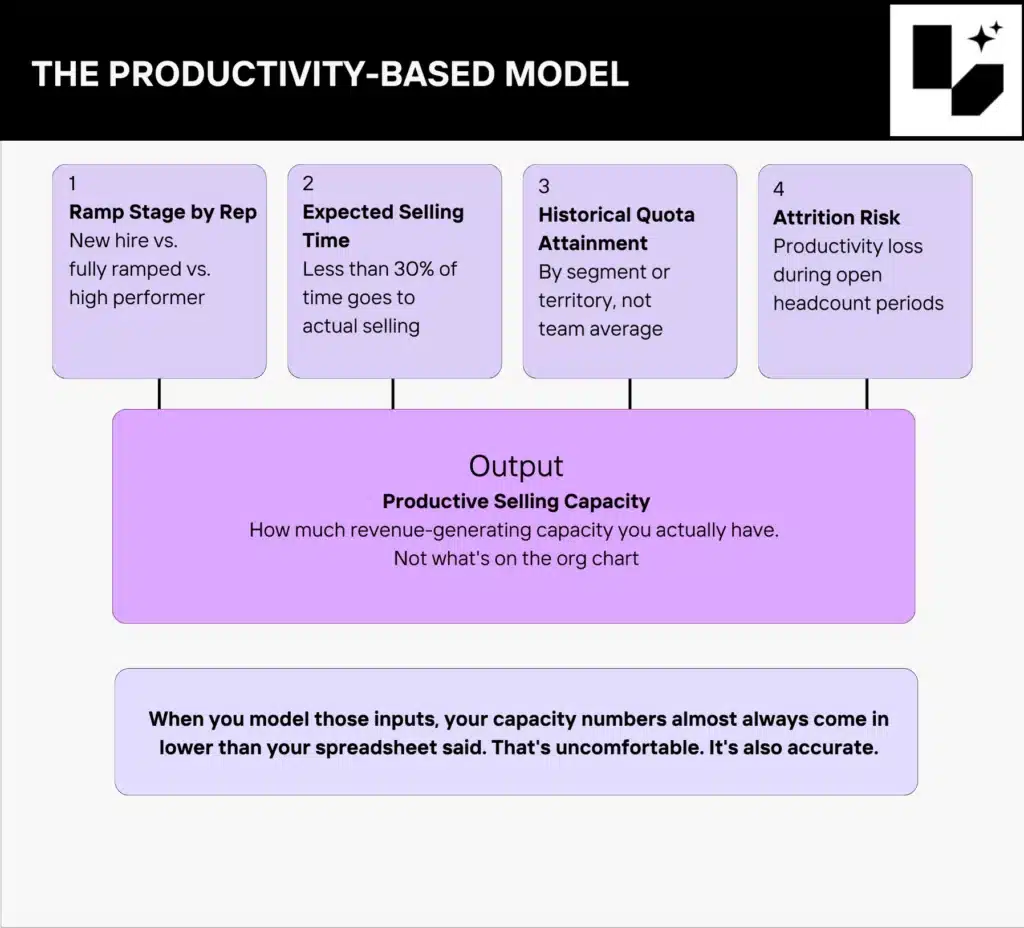
That means modelling for:
- Ramp stage by rep (new hires vs. fully ramped vs. high performers)
- Expected selling time per rep (accounting for the reality that less than 30% of time goes to actual selling)
- Historical quota attainment by segment or territory
- Attrition risk and the productivity loss during open headcount periods
When you model those inputs, your capacity numbers almost always come in lower than your spreadsheet said. That’s uncomfortable. It’s also accurate.
And accurate is what you need when you’re making hiring decisions, setting targets, and forecasting revenue.
Mid-quarter is already too late
Most teams don’t realise their model is broken until they’re already off track.
By then you’re in triage mode. The pipeline gap is real, the quarter is half gone, and the options are bad. You either miss the number or you make short-term decisions that create longer-term problems.
Productivity-based planning gives you the signal earlier. If you know your ramped capacity in February, you can adjust in February. You can change territories, adjust quotas, accelerate hiring decisions, or reset expectations upward before the gap becomes a problem.
The difference between companies that manage this well and companies that don’t usually isn’t data. It’s whether they’re looking at the right data.
What this looks like in practice with Lative
Here’s a scenario that comes up constantly.
A RevOps leader is three weeks into Q1. The plan shows 18 reps carrying quota. Finance is expecting $4.2M in bookings for the quarter. Everyone signed off on the number in December.
Then they pull the actual picture:
- 4 reps are still ramping. At 50% productivity, they’re carrying half a quota each.
- 2 reps are underperforming at roughly 60% of historical attainment.
- 1 territory has been open for six weeks. That headcount exists on paper but produces nothing.
Run the real numbers and your $4.2M plan is carrying maybe $2.9M in actual productive capacity. That’s not a forecast risk. That’s a structural gap. And it was baked in before the quarter started.
This is exactly the problem Lative is built to surface. The platform pulls live data from your CRM, HRIS, and finance systems and calculates true productive capacity by rep, by segment, by region. Not headcount. Not deployed quota. Actual expected output based on ramp stage, historical attainment, and real selling time.
Once you can see it, you can act on it. You can run what-if scenarios before you commit. What happens to capacity if the open territory stays unfilled for another 30 days? What does a one-month hiring delay cost you in bookings? What if you move two enterprise reps to your fastest-growing segment?
David McCummiskey, VP Sales Operations at KX, put it directly: “Every day in our company there are changes to our sales organization that impact our capacity. The only way to keep up to this is to measure capacity and update our revenue plans as these changes happen.”
That’s the shift. From a plan built once in January to a live model that reflects your team as it actually is today.
If you want to see what your current productive capacity actually looks like, and where the gap is between that number and your revenue target, Lative will show you in a single session.
The bottom line
Headcount models feel precise. They’re just not accurate.
Your revenue target doesn’t care how many names are on your org chart. It cares how many hours of productive selling time those people are generating, whether they’re ramped, whether they’re hitting quota, and whether the plan you built in January still holds in April.
If your capacity model can’t answer those questions, it’s not a capacity model. It’s a headcount spreadsheet with an optimistic set of assumptions bolted on.
The first step is admitting what the model is actually measuring. The second is building one that measures what matters.