A good sales forecast template turns a pile of pipeline into a number you can defend. This free template gives you a structured starting point: weighted pipeline, capacity adjustments, and a roll-up that ties to your target, built for B2B SaaS teams in Excel and Google Sheets. It also encodes the discipline most forecast spreadsheets skip, which is the part that actually determines accuracy.
The skipped discipline is expensive. RepVue’s Q2 2025 Cloud Sales Index found 57.31% of SaaS reps missed quota across roughly 47,000 reps, and most of those misses passed through a forecast spreadsheet that said things were fine.
The difference between a template that predicts and one that decorates is in the structure, so this guide covers what the template includes, how to fill each tab honestly, two worked examples, and the point at which the spreadsheet itself becomes the bottleneck.
What the template includes
- Deal-level pipeline tab. Every open opportunity with amount, stage, segment, close date, and a stage weight derived from your trailing conversion data, not CRM defaults.
- Capacity tab. The rep roster with start dates, ramp positions on a month-by-month curve, and trailing attainment, so the forecast reflects who is actually producing. This tab is what most forecast templates omit entirely.
- Roll-up tab. Weighted pipeline against target, capacity against target, and the gap between the two readings, because when the pipeline forecast exceeds what the roster can deliver, one of them is wrong.
- Scenario columns. Best case, commit, and worst case with written definitions per tier, so disagreements resolve deal by deal instead of vibe by vibe.
- Accuracy log. Week-one forecast versus quarter-end actual, by segment, because the feedback loop, not the formulas, is what improves forecasting over time.
Choosing your forecasting method inside the template
The template supports the two methods worth running and makes them argue productively. The stage-weighted method (pipeline tab) answers what current demand should yield: fast, deal-grounded, and blind to staffing.
The capacity-based method (capacity tab) answers what the roster can produce: structural, hiring-aware, and blind to this quarter’s specific deals. Neither is sufficient alone, which is the quiet flaw in most single-method templates.
The reconciliation row is where they meet, and the operating rule is simple: commit the lower reading, investigate the gap. Teams sometimes add a third, historical run-rate, as a sanity stripe: last four quarters’ actuals trended forward. When all three readings cluster, confidence is earned; when one diverges, the divergence names its own investigation, demand, supply, or trend break.
How to fill it in: the five passes
Pass one, clean the pipeline. Before any math: every deal gets an honest close date, a current stage with a written exit criterion behind it, and zombie deals (no activity in your trigger window) get closed-lost or downgraded. Ten minutes of hygiene moves the forecast more than any formula.
Pass two, derive stage weights. Pull the trailing two to four quarters of stage-to-stage conversion by segment and use those rates as the weights. CRM defaults (10/25/50/75/90) are folklore; your actuals are the forecast. At the current 21% average B2B win rate reported in Landbase’s 2026 benchmark analysis, default weights overstate most pipelines badly.
Pass three, build the capacity floor. For each rep: quota times trailing attainment, ramp-adjusted by their month on the cohort curve. Sum it. This is what the team can structurally deliver, independent of this quarter’s pipeline; the math is in how to calculate sales capacity.
Pass four, reconcile the two readings. Weighted pipeline says what demand should yield; capacity says what supply can produce. Commit the lower number, and treat the gap as the diagnosis: pipeline above capacity means deals will be neglected, capacity above pipeline means a demand problem next quarter.
Pass five, log and repeat weekly. Update deals, refresh the roll-up, and log the forecast. The log is the tab that makes you better every quarter, because forecast bias is stable per team and correctable once measured.
Running the weekly forecast meeting from the template
The template doubles as the meeting agenda. Twenty minutes: five on hygiene (what moved, what went zombie), five on the commit tier deal by deal (anything new in or out, with the written definition enforced), five on the reconciliation row (pipeline reading versus capacity reading, and which lever owns any gap), and five on the accuracy log (how did last quarter’s same-week forecast track, and what bias is the log showing).
The agenda’s value is that every disagreement lands on a specific cell with a specific owner, which is the difference between a forecast meeting and a feelings meeting.
Worked example one: the pipeline said yes, the template said no
A hypothetical six-rep team enters the quarter with $4.1M of raw pipeline against a $1.5M target. Default-weighted, the forecast reads $1.7M: comfortable. The template’s passes change it. Honest stage weights from trailing actuals cut the weighted number to $1.35M, because half the dollars sit in stages that historically convert at 14%.
The capacity tab shows two reps in months three and four of a six-month ramp: ramp-adjusted capacity is $1.38M. The reconciled commit is $1.3M to $1.4M, the gap to target is named in week one, and the team pulls two specific levers (a pipeline sprint in the strongest segment, one enterprise deal pulled forward) instead of discovering the miss in week eleven. The raw spreadsheet would have reported $1.7M until it could not.
Worked example two: the sandbagged commit
The same team, next quarter: reps commit $1.1M against a $1.5M target, and the room braces for a miss. The template disagrees. Weighted pipeline reads $1.55M on derived weights; capacity reads $1.52M with both ramping reps now at full curve; and the accuracy log shows this team’s week-one commits have landed 18% low for three straight quarters.
The evidence-based forecast is $1.45M to $1.55M, the panic hiring conversation is cancelled, and the actual lands at $1.49M. Forecasting bias runs both directions, and only a logged history catches the sandbag as reliably as the happy ears.
Template limitations, honestly
This template fixes structure, not physics. It is still a snapshot: the moment a hire slips or a big deal moves, every dependent cell is stale until someone re-keys it, and the weekly refresh discipline is carried entirely by a person.
It handles one segment cleanly; at two or more segments with separate weights, curves, and attainment, the tab count triples and version drift begins. And it cannot push back: a spreadsheet will let you type an optimistic weight without comment. Those are not flaws in this template; they are the operating limits of any spreadsheet forecast, and they define exactly when to graduate.
From template to live model
The graduation point is predictable: cohort hiring plus a second segment, usually somewhere between $10M and $25M ARR. Past it, the template’s weekly refresh becomes a part-time job and the version conflicts begin.
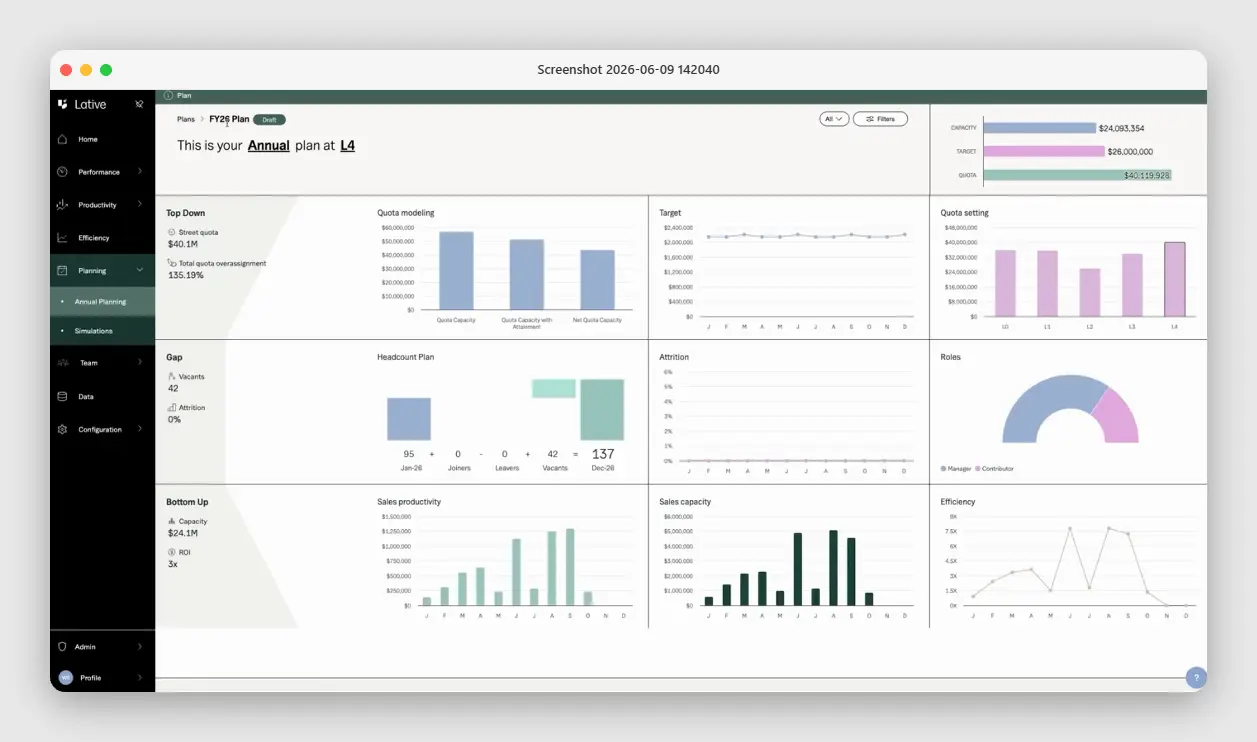
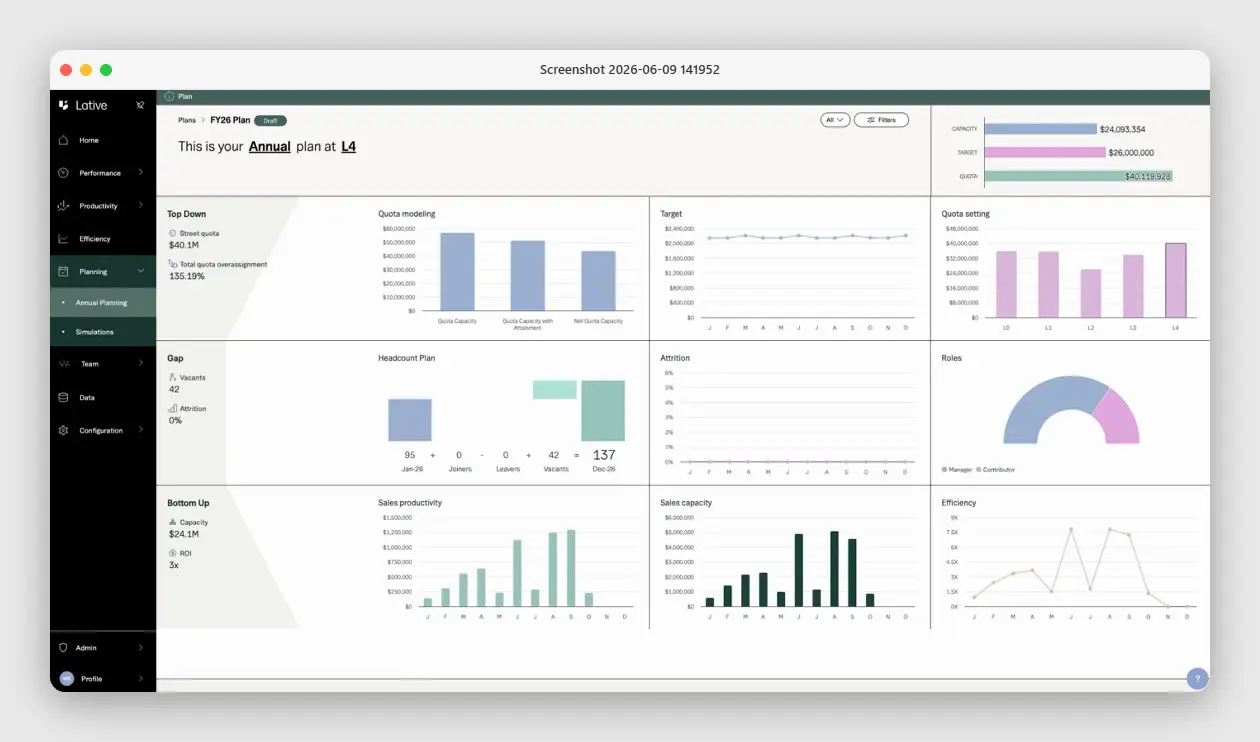
Lative is the live version of this exact structure: the Productivity module supplies real per-rep production, tenure-adjusted and segmented; Average Ramping Time replaces the ramp-curve tab with curves derived from your actual cohorts; the Capacity view maintains the capacity floor continuously; and Annual Planning runs the reconciliation, pipeline, capacity, target, and quota on one screen, every day instead of every Friday.
The template teaches the discipline; the platform removes the manual labor of keeping it true. See what is sales forecasting for the methodology behind both.
Frequently asked
What should a sales forecast template include?
Deal-level weighted pipeline, a capacity tab with ramp-adjusted rep productivity, a roll-up reconciling both against target, tiered scenario columns with written definitions, and an accuracy log.
How do you weight pipeline stages in a forecast?
Derive weights from your trailing two to four quarters of stage-to-stage conversion, by segment. CRM default percentages overstate most pipelines at current win rates.
Why does a forecast template need a capacity tab?
Because pipeline forecasts what demand should yield while capacity bounds what the team can deliver. Forecasts that exceed ramp-adjusted capacity miss high, reliably.
How often should the forecast template be updated?
Weekly. A forecast refreshed monthly is a historical document, and the accuracy log only works if the cadence is consistent.
When should a team move off a forecast spreadsheet?
When cohort hiring and a second segment make the weekly refresh a part-time job, typically between $10M and $25M ARR. The signal: version conflicts and stale tabs in the Monday meeting.
What is the difference between commit, best case, and pipeline tiers?
Commit is deals with verified buying process and confirmed close dates. Best case adds real deals carrying one open risk. Pipeline is qualified but early. Written definitions, audited quarterly, keep the tiers meaningful.
The template’s deepest value is cultural: it makes the forecast a derived number rather than a negotiated one, and that change outlives the spreadsheet itself.
Download the template, run the five passes, and commit the reconciled number. When the spreadsheet starts costing more than it informs, see the full sales capacity planning guide, or book a demo to see the live version of this exact model.