

Spencer Stuart’s 2026 CMO tenure research puts average CMO tenure at 4.1 years, the shortest of any C-suite role. I’ve watched the same pattern repeat for 20 years: the CMO gets replaced not because the campaigns were bad, but because the model was disconnected.
Marketing reported in leads. Sales reported in opportunities. Finance reported in revenue. Three incompatible scorecards of the same funnel. No shared foundation means no shared accountability, and eventually no shared trust.
Lative was built to end that. Here is how the marketing intelligence platform is structured and what it changes operationally when you use it.
Why marketing stacks do not produce revenue-grade data
Most marketing teams rely on three categories of systems: marketing automation, CRM, and business intelligence tools. Layered on top are point solutions for intent data, account-based marketing, and pipeline forecasting that each ship with their own definition of an opportunity. Each was designed for maximum flexibility, which means there is no built-in playbook for connecting them into a coherent GTM data model. The resulting data is isolated from how sales and finance track performance.
Lative’s survey of more than 500 executives across marketing, sales, finance, and C-level roles found that 85% of executive teams cannot consistently map marketing spend to revenue outcomes. That gap exists not because the data is unavailable, but because marketing’s systems are not connected to the opportunity records that finance and sales use to track performance.
The teams that try to close the gap manually fall back on spreadsheets that go stale the moment they are exported.
How the platform is structured
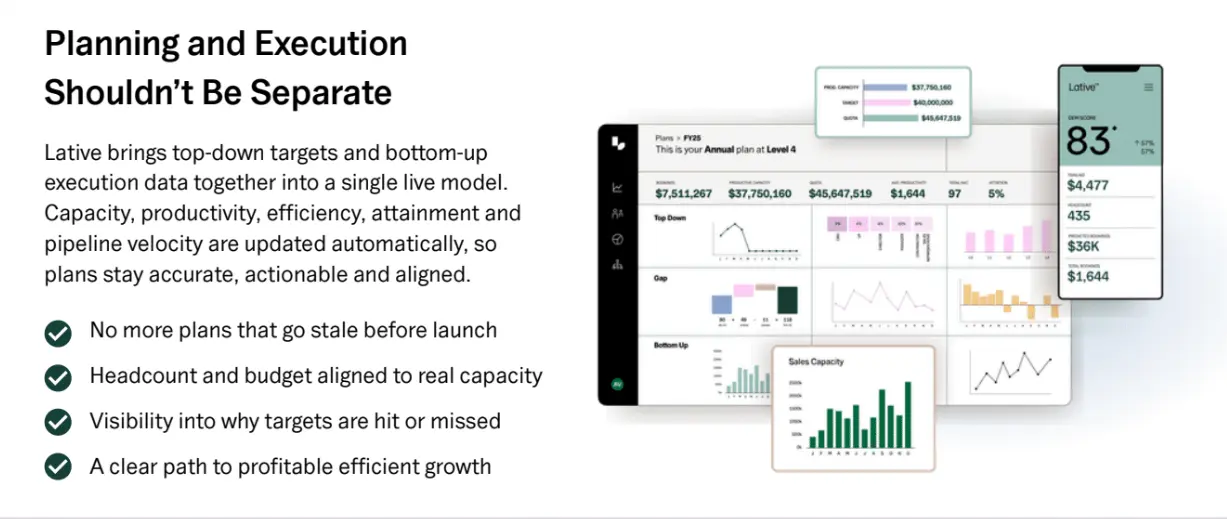
You have probably spent the week before a board review reconciling three different versions of the same pipeline number. The architecture is the problem, not the process. Lative’s Marketing Intelligence platform consists of five integrated modules, each addressing a distinct layer of the GTM demand engine, all operating on the same underlying data model.
Fiscal Year Marketing Planning
Most annual marketing plans are built in a spreadsheet, locked at the start of the year, and outdated before Q2 ends. The Planning module applies AI forecasting to your operational data to generate target metrics aligned to quarterly sales goals.
Here is what I have found about AI in GTM planning after two decades of watching capacity plans get built wrong: AI changes the shape of what is possible.
OpenView’s 2023 SaaS Benchmarks report, based on 710 operators, found that 77% of SaaS companies launched AI features in 2023, but only 15% successfully monetized them. The gap between having AI and benefiting from it is almost entirely a data quality problem: AI running on fragmented, unreconciled GTM data produces outputs that no one trusts enough to act on.
The planning module works because the AI runs on unified actuals, not on a disconnected data stack.
When the Planning module generates targets based on your actual conversion rates and deal cycles, AI changes the inputs to the capacity planning judgment call. The targets are yours, built from your data, not from benchmarks that assume your market works like everyone else’s. When assumptions shift mid-year, the plan adjusts in real time instead of waiting for the next quarterly offsite. That same planning foundation extends into Lative’s sales capacity planning, so marketing targets and the sales capacity behind them run on one model.
Marketing Highlights
You can spend hours pulling the metrics you need for an executive review and still walk out without a clear answer on demand engine health. Marketing Highlights provides an interactive overview of the critical strategic metrics:
- Demand generation rates: how fast your funnel is filling at each stage
- Funnel conversion rates: where throughput is breaking down
- Campaign performance: what is driving pipeline and what is not
- ICP coverage and target account penetration: how well you are reaching the accounts that matter
All metrics link to corresponding Revenue Insights for deeper analysis, and every view can be filtered by user-defined market segments or exported for presentations.
Revenue Insights
Preparing data for a board meeting takes days. Then someone asks a follow-up question and the process starts again. Revenue Insights is the analytical core of the platform: an interactive set of visualizations covering Revenue Generated, Campaign Attribution, Marketing Pipeline Forecasting, Sales Pipeline Coverage, and Cohort Analysis.
You can filter by firmographic dimensions including industry, region, and product to isolate the key drivers behind any number. This eliminates the days traditionally spent preparing data before a board meeting or executive review. For a closer look at the specific visualizations available, see the Revenue Insights overview.
Multi-Touch Attribution
Your CFO will eventually ask which programs are actually driving revenue. If the answer involves a spreadsheet, that conversation will not go well. The Attribution module identifies the strategic value of content and campaigns across the full buyer journey.
Lative supports four attribution models: first-touch, last-touch, linear multi-touch, and a proximity-based model that weights touchpoints by their relative influence on deal value. This gives you a defensible, data-driven answer to the question every CFO eventually asks. See how multivariate campaign attribution works in practice.
Revenue Supply Chain
Marketing accepts credit for a lead the moment it converts. Sales takes ownership the moment they accept the opportunity. Everything in between is a gap in visibility that neither team owns.
The Revenue Supply Chain provides a single end-to-end view of how opportunities progress from initial marketing engagement through to close. When Benchling‘s CMO, CRO, and CFO needed to trace every pipeline coverage figure back to the same opportunity data, the Revenue Supply Chain was the view that made it possible.
Every opportunity is supported by detailed data: firmographics, time in each funnel stage, an Account Quality Index, and campaign responses. For the full explanation of how the model works, see the Revenue Supply Chain post.
What to look for in a marketing intelligence platform
If you are evaluating a marketing intelligence platform alongside the Lative architecture above, there are a handful of capabilities that separate revenue-grade systems from prettier dashboards. The shortlist is short on purpose: multi-touch attribution that actually weights touchpoints by influence on closed revenue rather than first-click vanity, real-time pipeline insights calculated from the same opportunity records sales and finance use, predictive analytics that runs on unified actuals instead of fragmented exports, native support for sales-marketing alignment through a single shared funnel, and a deployment model your RevOps team can stand up without a data engineering project. Platforms that miss any one of those still leave you reconciling numbers in the same spreadsheet you were trying to retire.
What changes when your GTM data is unified
Walk into your next board meeting and you will almost certainly see marketing’s pipeline number and sales’s pipeline number disagree. That gap closes when both numbers are calculated from the same underlying data.
When AskNicely rebuilt their demand engine on Lative’s data foundation, the question shifted from whose number is right to what do we do about it. They cut cost per opportunity by 30% in one quarter. The architecture was the change. Not the reporting. Not the dashboards. The shared model underneath.
Annual planning stops being a spreadsheet rebuild. AI-generated targets based on your actual conversion rates and deal cycles change the shape of planning, not just its speed. When assumptions change mid-year, the plan adjusts in real time. The plan breathes with your business instead of going stale by February.
Attribution stops being a political argument. When your CFO asks which programs are driving revenue, you have a model-backed answer: this campaign influenced this much pipeline, at this stage, across these buyer segments, weighted by proximity to close. Investment decisions happen in the same quarter as the data.
The underlying architecture
Lative runs on a serverless data warehouse: no hardware provisioning, no dedicated infrastructure, operational in under a day. The platform connects to Salesforce CRM (Professional edition or higher) via OAuth 2.0, read-only, with all data encrypted in transit and at rest. Marketo, HubSpot, and Salesforce Marketing Cloud are supported as marketing automation sources.
There is no two-way sync and no write access to CRM data. There is no per-user pricing. For the full security architecture, see the platform security overview.
Once connected, every stakeholder who needs access to marketing intelligence, from CMO to RevOps to finance to sales leadership, works from the same data without additional license costs or seat negotiations.
One Pipeline Number, No Reconciliation Layer
If your last quarterly review had marketing reporting one pipeline number and sales reporting another, that gap is what this platform was built for. See it in action with your own GTM data.
Key Takeaways
- 85% of executive teams cannot consistently map marketing spend to revenue outcomes. The cause is architecture, not effort.
- A marketing intelligence platform produces revenue-grade data only when planning, attribution, and pipeline insights all run on the same underlying GTM data model.
- AI forecasting in fiscal year planning is only as good as the actuals it runs on. 77% of SaaS companies launched AI features in 2023 but only 15% monetized them, and the gap is almost entirely a data quality problem.
- Proximity-based multi-touch attribution gives finance and the CFO a defensible answer to “which programs drove revenue” without a quarterly spreadsheet rebuild.
- The Revenue Supply Chain closes the visibility gap between marketing’s lead handoff and sales’s opportunity ownership. When AskNicely rebuilt their demand engine on this foundation, cost per opportunity fell 30% in one quarter.
FAQ
How long does a marketing intelligence platform take to deploy?
Lative runs on a serverless data warehouse with no hardware provisioning and connects to Salesforce CRM via read-only OAuth 2.0. Initial deployment is operational in under a day. Time-to-trust on the data, where every stakeholder agrees the numbers match, typically aligns with your next quarterly close.
Does the platform replace our marketing automation or CRM?
No. Lative connects to Marketo, HubSpot, or Salesforce Marketing Cloud as marketing automation sources and to Salesforce Professional edition or higher as the CRM. There is no two-way sync and no write access. The platform sits above the existing stack as the GTM data model that planning, attribution, and pipeline insights all read from.
How does Lative handle attribution differently from CRM-native or spreadsheet-based reporting?
CRM-native attribution typically defaults to first-touch or last-touch and treats every touchpoint as equally weighted. Lative supports first-touch, last-touch, linear multi-touch, and a proximity-based model that weights touchpoints by their relative influence on deal value. That last model is what gives the CFO a model-backed answer instead of a spreadsheet argument.
Werner Schmidt — Werner Schmidt is the CEO and Co-founder of Lative, with over 20 years of experience in Revenue Operations with companies including Forcepoint, Aruba Networks, Citrix, and Sage.