Since I started working with sales orgs, there’s been an insidious pattern that often creeps in at the beginning of the year. The bosses approve the X revenue target, and the headcount gets the green light. Quotas are distributed, and the numbers are crunched. They then hire a certain number of reps, assign each a quota, and total the columns.
Q2 arrives, and the number starts slipping. Q3 is worse. By Q4, there’s a post-mortem happening that somehow nobody saw coming, even though the warning signs were there in January.
The root cause almost always traces back to the same mistake: they planned around headcount, not productive capacity. Those two things sound similar, but they are absolutely not the same thing.
This guide is for sales leaders and RevOps teams who are mid-year or heading into a new planning cycle and want to build a plan that actually holds up under pressure. I’m going to walk through why headcount-based planning breaks, what capacity-based planning looks like in practice, and the steps you can take right now to close the gap.
Why Headcount Planning Keeps Failing
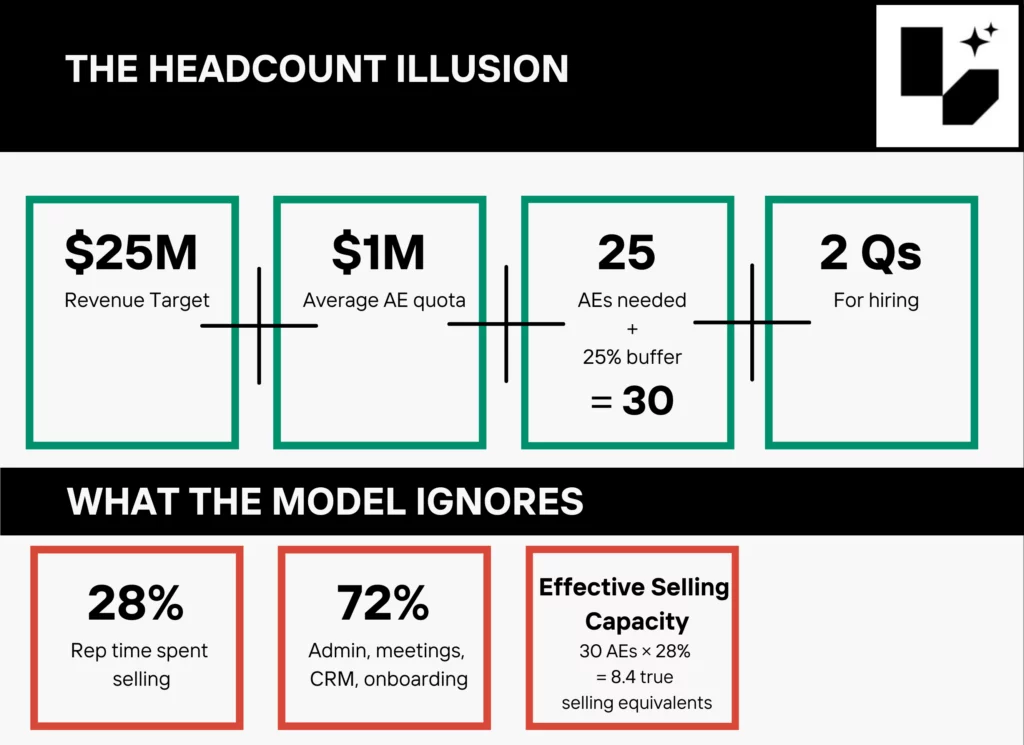
The standard model goes like this. You have a $25M revenue target. Your average AE quota is $1M. So you need 25 AEs. Maybe you add a 20% buffer, bring it to 30. You give yourself two quarters to hire, and you go into the year feeling covered.
What that model doesn’t account for is how much of a typical rep’s time is actually spent selling. According to Salesforce’s sixth State of Sales report (a survey of 5,500 sales professionals across 27 countries) reps spend around 70% of their time on non-selling tasks: admin, internal meetings, CRM updates, onboarding calls. The selling window is the remaining 30%, and that’s before you account for ramp time or territory gaps.
And that’s before you factor in ramp time.
So when you’re modelling capacity, you’re not working with 25 full units of selling power. You’re working with a fraction of that.
Ramp time compounds the problem. According to The Bridge Group’s 2024 AE SaaS Metrics report, the average time for a new AE to reach full quota is 5.7 months; up from 4.3 months in 2020. If you’re hiring in Q1 and expecting meaningful contribution by Q2, that’s an optimistic assumption in most markets. And if you lose an experienced rep mid-year, their replacement resets that clock.
Then there’s the quota distribution problem. Not all territories are equal. Not all reps perform at the same level. When you apply averages across a mixed team with varying tenure, market conditions, and territory potential, the aggregate looks clean but the individual-level gaps go unexamined; until they surface as forecast misses.
By the time Q3 rolls around, teams are genuinely surprised. Their headcount plan hit perfectly. The productive capacity didn’t.
What Productive Capacity Planning Actually Means
Shifting to capacity-based planning means modelling what your team can realistically produce, not just how many bodies are in seats.
The inputs change significantly. Instead of headcount times quota, you’re going to need data that is much more difficult to gather and highly complex models to do the necessary calculations.
How many of your reps are actually ramped versus still finding their footing?
What does attainment look like across different tenure cohorts?
Because a rep in month three performs nothing like one in month eighteen.
When someone quits, how long before their replacement is carrying a real number? How much of a rep’s week gets eaten by meetings, admin, and everything that isn’t selling? Does pipeline coverage hold up across every territory, or are certain regions running on fumes?
The ramp time issue deserves specific attention here because it’s one of the most consistently underweighted inputs in capacity models. A rep hired in January at a 5.7-month average ramp isn’t fully productive until late June, at the earliest. If that rep inherits an underdeveloped territory or goes through a slower-than-average onboarding, the contribution gap stretches further. Building a capacity model that accounts for where each rep sits on their ramp curve (rather than treating all headcount as equivalent) is one of the highest-leverage changes most teams can make.
And maybe the most uncomfortable question: was quota set because sales capacity can actually support it,, or because the number looked right in a deck?
That sounds like a lot more work, and it is. But this productive capacity approach surfaces problems early enough to actually do something about them.
For example, if your capacity-based model shows that three territories are under-covered heading into Q2, you can reallocate accounts, adjust coverage, or pull forward a hiring decision before it shows up as a miss at the end of the quarter. In headcount-based planning, you don’t see that problem until it’s already happened.
The other major difference is how you treat mid-year changes. People leave. Deals slip. Territories perform differently than projected. In a headcount plan, these events tend to be absorbed by optimism until the quarter closes, when the shortfall becomes undeniable. In a capacity-based model, you’re tracking leading indicators, pipeline coverage, rep productivity trends, ramp progress, and adjusting in near real time rather than waiting for lagging indicators to tell you what’s already happened.
Steps to Rebuild Your Plan Mid-Year
If you’re already in the year and the forecast is shaky, here’s how I’d approach it.
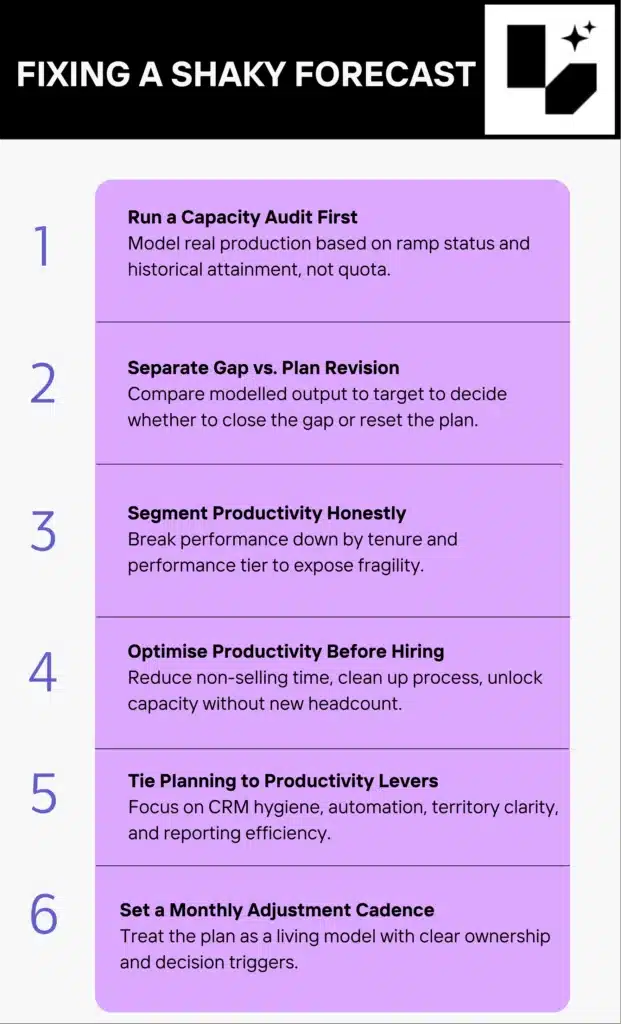
Start with a capacity audit, not a pipeline review
Most sales leaders under pressure default to interrogating deals. What’s closing this quarter? What can we pull forward? That helps in the short term but doesn’t fix the structural issue. Before you touch the pipeline, understand what your team is actually capable of producing with current staffing, current ramp status, and realistic attainment assumptions.
Build a simple model: take your ramped reps, apply their historical attainment rate (not quota), multiply by the remaining quarters, and compare that to target. Do the same for non-ramped reps using a conservative ramp curve. What that number tells you is whether you’re in a gap-closing conversation or a plan revision conversation. Those require different actions.
Segment productivity honestly
One mistake I’ve seen repeatedly is treating the team as a single performance unit. In reality, there’s usually a meaningful spread between top performers, middle performers, and struggling reps. If your top two AEs are carrying a disproportionate share of attainment, your capacity model is fragile even if the aggregate looks fine. If those two reps churn or hit a slow patch, the whole number falls faster than expected.
Break attainment down by tenure bracket at minimum. Reps in their first year, reps in their second year, reps beyond that. Each group has a different realistic production level. Once you see the distribution, you can make better decisions about where to invest in enablement, where to adjust quotas, and which territories need additional coverage.
Align planning with productivity levers, not just headcount levers
This is one of the bigger mindset shifts in capacity-based planning. Headcount is expensive, slow to deploy, and carries ramp risk. But there are other ways to increase capacity.
Salesforce’s 2024 State of Sales data puts average non-selling time at 70% of a rep’s week. Even a modest reduction in that number frees up meaningful selling hours across the organisation without a single new hire. Better CRM hygiene, automated follow-up sequences, cleaner territory assignments, reduced internal reporting burden. These aren’t glamorous interventions, but they compound.
McKinsey’s research on B2B sales productivity found that top-quartile sales performers generate 2.6 times higher gross margin per sales dollar than bottom-quartile teams. The gap between those cohorts rarely comes down to headcount. It comes down to how well time, process, and enablement are structured around the actual selling window.
Before defaulting to a hiring decision, it’s worth modelling what a 10-point improvement in selling time would do to your capacity number. For many teams the answer is materially significant; enough to defer a hire, or to redirect budget toward enablement rather than salaries.
Set a cadence for in-year plan adjustment
Annual plans become obsolete almost immediately because the assumptions they’re built on start changing on day one. The best-run RevOps teams I’ve seen treat the plan as a living document with a defined update cadence, usually monthly at a minimum, where actuals are compared against planned capacity, and adjustments are made based on the data.
This doesn’t mean chasing every data point or creating analysis paralysis. It means having a clear framework for when a variance is signal versus noise, and a defined process for what happens when the signal appears. Who owns the decision to adjust hiring timing? Who owns the decision to revise coverage? Who owns the conversation with leadership when the plan needs to change?
Without that framework, capacity issues get spotted but not acted on. With it, they get resolved before they compound.
The Mid-Year Execution Reality
Here’s the honest version of what capacity-based planning looks like when you try to implement it mid-year: it’s harder than doing it at the beginning of the year, and you will find gaps you didn’t know existed.
Some of those gaps will be fixable. Some won’t be, at least not this year. If you’re six months into the year and discover you’re short three full quarters of productive capacity, there are limits to how much you can recover. But knowing that clearly is genuinely better than finding out at year-end. It changes how you communicate with leadership, how you prioritise enablement investment, and how you think about what’s realistically achievable versus what requires a plan revision.
The teams I’ve seen navigate this well have one thing in common: they separate the “what the data shows” conversation from the “how do we feel about it” conversation. Capacity modelling tells you what’s real. What you do with that information is a separate, human decision. But you can’t make good decisions with bad inputs, and headcount math dressed up as capacity planning is bad inputs.
Where Tools Fit Into This
There’s a reasonable question about tooling here. Some of what I’ve described above is doable in a well-built spreadsheet, especially for smaller teams. For teams with more complexity, multiple segments, multiple products, geographies, hybrid motion, the manual approach starts to break down because the model becomes too large and too interdependent to update reliably by hand.
Platforms built specifically for sales planning and capacity modelling, tools like Lative, which handles this type of revenue intelligence at a level of granularity that spreadsheets simply can’t maintain, are worth evaluating if you’re dealing with that complexity. The key is finding a way to automatically connect your actual performance data to your plan assumptions, so the model reflects reality rather than what you built in January.
For teams dealing with that level of complexity, Lative’s sales capacity planning module connects live CRM and productivity data to your capacity model, so the plan reflects what’s actually happening rather than what you built in January. The stress-testing guide on the Lative blog covers how to run a quarterly capacity audit. Useful if you want a structured framework for the mid-year process described in this article.
What I’d caution against is buying a sophisticated planning tool and not changing the underlying process. The tool amplifies whatever your approach is. If the approach is still headcount math with more dashboards on top, you’ll end up with expensive headcount math.
The Bottom Line
Forecast misses in 2026 are rarely about individual deal outcomes. They’re almost always about planning models that didn’t account for how productive capacity actually works.
The fix isn’t complicated in theory. Model what your team can actually produce. Track leading indicators rather than waiting on lagging ones. Adjust the plan when the data tells you to. Invest in productivity improvements before defaulting to headcount additions.
It’s harder to execute than it sounds, mostly because it requires having uncomfortable conversations earlier in the year rather than deferring them. But the teams that do it consistently are the ones whose forecasts hold up, not because they got lucky, but because they built a plan on realistic inputs and stayed close enough to the data to catch problems while there was still time to respond.
That’s the difference between a forecast that misses and one that doesn’t.