
Your VP of Sales says you need to hire 10 more reps to hit next quarter’s number. Your CFO wants to know why revenue per rep dropped 18% last quarter. Your board is asking if the current team can support a $50M ARR target.
These aren’t hypothetical questions; they’re the daily reality for revenue leaders. And they all hinge on one critical metric that most companies still measure incorrectly: sales productivity.
There’s more to sales productivity measurement than just reaching numbers. It’s about understanding how efficiently revenue is generated based on available sales capacity. Efficiency is just as critical as growth, and understanding and optimising sales productivity is no longer optional; it’s a strategic necessity.
Why measuring Sales Productivity matters
Measuring sales productivity allows businesses to evaluate how effectively their teams convert effort into revenue. Unlike traditional activity-based metrics, it evaluates performance in relation to capacity, focusing on what an organisation is actually able to produce with the resources available.
At its core, sales productivity follows this formula:
Sales Productivity = (Revenue Achieved in a Period by Dimension) / (Number of Sales Reps Able to Sell in That Period by Dimension)
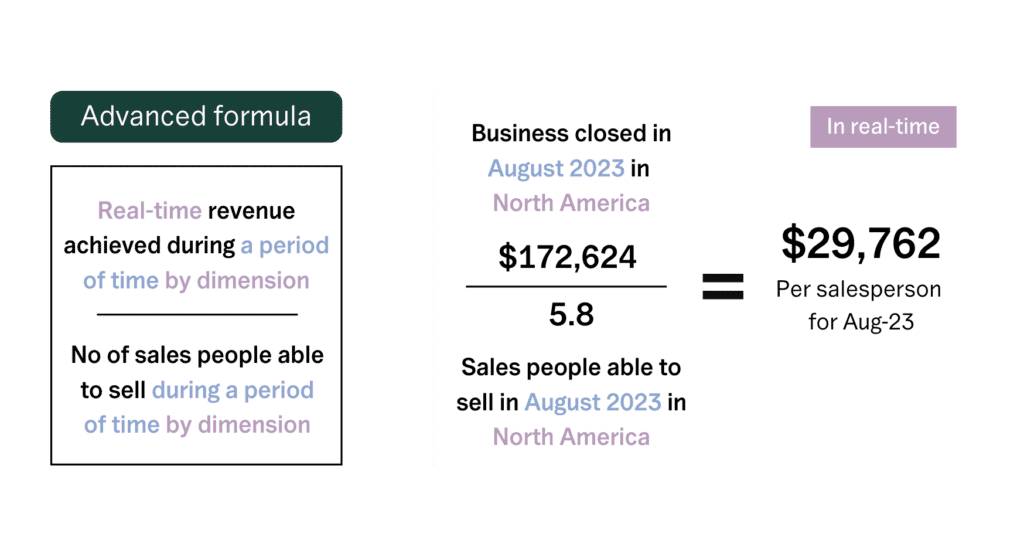
This formula highlights two critical factors:
- Revenue achieved in a given timeframe – The total revenue generated, broken down by relevant dimensions (e.g., region, product line, segment).
- Sales reps actively selling – The number of sellers who were fully ramped and capable of closing business in that same timeframe.
Unlike traditional sales metrics, measuring sales productivity accounts for actual production across the business dimensions. It provided a more accurate measure of true sales performance. Businesses that prioritise measuring sales productivity gain insights into revenue generation, sales efficiency, and overall performance.
Why traditional metrics fall short
Many companies still rely on quota attainment as their primary measure of success because calculating sales productivity accurately is complex. But quota attainment is a lagging indicator, as it tells you whether a number was reached, but not how efficiently or sustainably it was achieved.
For example:
- A rep could hit quota by closing one large, one-time deal, which doesn’t reflect ongoing productivity.
- Another rep might miss quota despite strong pipeline velocity due to external market factors.
- A team could be burning excessive resources to reach targets, making success unsustainable.
Sales productivity moves beyond raw output to evaluate whether sales teams are performing at the right level for long-term success.
Quota attainment is like checking the scoreboard after the game. Sales productivity, by contrast, gives you an in-game view. Especially when market conditions, buyer cycles, and ramp speeds are in flux.
Use Case: The “Successful” Rep Who’s Actually Underperforming
A rep hits 105% of quota and gets celebrated at the all-hands. But when you examine the details:
- They closed one massive deal worth $800K, a one-time enterprise logo that took 18 months to close
- Their pipeline for the next quarter is nearly empty
- They’ve been fully ramped for 9 months, but their total ARR contribution is $850K
- Meanwhile, another rep at 95% of quota closed 12 deals totalling $760K with a healthy pipeline for next quarter
Traditional quota attainment says Rep A is the winner. Sales productivity shows that Rep A generates $850K annually, while Rep B is on pace for $1.2M+, and Rep B’s revenue is far more predictable and sustainable.
Use Case: The Team That Looks Productive But Isn’t
Your sales team hit 98% of their combined quota last quarter. Leadership celebrates. But no one asks:
- How many reps were actually at full capacity versus still ramping?
- How much did it cost in discounting, extended sales cycles, and support resources to close that revenue?
- What’s the quality of the revenue (expansion potential, retention risk, deal size)?
When you calculate true productivity (revenue divided by fully ramped reps, not total headcount), you discover your team is 30% below benchmark for your stage and segment. You didn’t have a great quarter; you had an expensive and unsustainable one.
Use Case: Missing the Forest for the Trees
A rep misses quota at 87% despite strong pipeline velocity, solid activity metrics, and a healthy win rate. They get put on a performance improvement plan.
But the real issue? The territory they inherited had been neglected for 18 months, their patch has 40% fewer accounts than peers, and they’re ramping a new product that’s still finding product-market fit. Traditional metrics blamed the rep. Productivity metrics would have revealed the structural problem.
Why This Matters
Quota attainment is like checking the scoreboard after the game. Sales productivity, by contrast, gives you an in-game view, especially when market conditions, buyer cycles, and ramp speeds are in flux. Without it, you’re making multi-million dollar decisions (hiring, territories, quotas, comp plans) based on incomplete data.
So, what are the consequences?
- Overhiring when you should be fixing productivity issues
- Promoting reps who hit quota through one-time deals rather than sustainable performance
- Missing early warning signs that productivity is declining across the business
- Building capacity models that don’t reflect reality
Sales Productivity vs. Sales Efficiency: what’s the difference?
While the two are often used interchangeably, sales productivity and sales efficiency measure different things:
- Sales Productivity = How much revenue is generated per rep over a given timeframe.
- Sales Efficiency = The cost-effectiveness of generating that revenue (e.g., cost per deal, sales cycle length).
Both play a crucial role in revenue performance. Productivity helps assess how well sales teams are utilizing their capacity, while efficiency ensures that revenue growth remains sustainable. By understanding both, organizations can refine their sales strategies to optimize outcomes at scale.
You can be productive and inefficient, like a rep who closes lots of revenue but requires 3x the marketing spend and 2x the sales cycle. You can also be efficient but unproductive, running lean with excellent CAC and deal velocity, but not closing enough total revenue to hit your number.
Why sales productivity matters for Revenue leaders
RevOps isn’t just about reporting on sales metrics—it’s about enabling the organization to optimize its sales capacity and execution strategy. Productivity plays a key role in that effort by helping answer critical business questions, such as:
- Are we fully utilizing our sales capacity?
- How do we improve revenue per rep without overloading them?
- Which segments, regions, or product lines are underperforming relative to sales headcount?
- Where should we adjust hiring, training, or territory allocation to maximize performance?
Sales productivity is the lever that powers your headcount model, your quota plan, and your ability to hit number without overspending. When it drops, pipeline alone can’t save you.
By understanding how much revenue is being generated per rep, organizations can make smarter, more scalable decisions around sales planning and execution.
Key metrics that shape sales productivity
While quota attainment provides a surface-level view of performance, sales productivity requires a more comprehensive approach. Leading RevOps teams track a combination of efficiency-based and capacity-based metrics to gain a full picture of performance.
Pipeline velocity
How quickly opportunities move through the sales funnel. Faster movement = higher revenue potential.
Practical Benchmarks:
- SMB: 30-60 days from SQL to close
- Mid-Market: 60-120 days from SQL to close
- Enterprise: 120-240+ days from SQL to close
If your pipeline velocity is 2x your benchmark, investigate why. It could signal rushed deals, heavy discounting, or weak qualification. If it’s 50% slower than the benchmark, you’re leaving revenue on the table and need to diagnose where deals are stalling.
Revenue per rep
A direct measure of individual seller efficiency—how much revenue each sales rep generates.
Practical Benchmarks (ARR per Fully Ramped AE by Stage):
- Seed/Pre-Series A: $400K – $700K
- Series A: $700K – $1.0M
- Series B: $1.0M – $1.5M
- Growth/Series B+: $1.2M – $1.8M
- Enterprise-focused SaaS (mature): $1.5M – $2.5M+
In SaaS, top-performing reps generate $1.2M–$1.8M in ARR annually at the growth stage. If your team is averaging $800K, there’s a gap to investigate. Either in enablement, pipeline generation, territory structure, or product-market fit.
Segment-specific benchmarks:
- SMB-focused reps: $600K – $900K
- Mid-Market reps: $1.0M – $1.5M
- Enterprise reps: $1.8M – $3.0M
These ranges assume fully ramped reps selling a product with strong product-market fit. If you’re early-stage or mid-pivot, expect to be on the lower end.
Ramp time
The time it takes for a new rep to become fully productive. The faster the ramp, the greater the overall sales capacity.
Practical Benchmarks:
- SMB AE: 2-3 months to full productivity
- Mid-Market AE: 4-6 months to full productivity
- Enterprise AE: 6-9 months to full productivity
- Strategic/Named Account AE: 9-12 months to full productivity
Ramp time is often underestimated. According to HubSpot’s 2024 Sales Enablement Report, the average AE takes 6.2 months to fully ramp. Cutting that by even 2 weeks can unlock millions in additional pipeline capacity over a year.
Why this matters: If you hire 10 reps with a 6-month ramp, you don’t gain 10 units of capacity on Day 1; you gain ~5 units of capacity in Month 3, 7.5 units in Month 4, and 10 units by Month 6. Most capacity models ignore this and dramatically overestimate near-term revenue potential.
Win rates by segment
Understanding which customer segments generate the highest conversion rates helps teams focus efforts where they matter most.
Practical Benchmarks (Opportunity to Close):
- SMB: 20-30% win rate
- Mid-Market: 15-25% win rate
- Enterprise: 10-20% win rate
Higher complexity and longer sales cycles typically mean lower win rates. If your win rates are significantly below these benchmarks, investigate whether it’s a qualification problem (too many unqualified opps), a competitive problem (losing to alternatives), or a product problem (not solving the pain well enough).
Time allocation per rep
What percentage of a rep’s time is actually spent selling versus administrative or non-revenue-generating tasks?
Industry Benchmark: Salesforce’s State of Sales report shows reps spend just 28% of their time actually selling. The rest is consumed by:
- Internal meetings
- CRM data entry
- Proposal creation
- Deal coordination
- Training and enablement
The opportunity: If you can move that from 28% to 35% through better tools, processes, or support resources, you’re effectively adding 25% more selling capacity without hiring a single new rep. That’s the equivalent of hiring 2.5 reps on a 10-person team, for free.
How to optimize sales productivity
Measuring sales productivity and increasing it isn’t about pushing reps to work harder—it’s about removing barriers to efficiency and ensuring that effort is focused in the right places.
- Align sales capacity with revenue goals
Productivity isn’t just an individual metric—it’s an organizational one. If too few reps are responsible for an ambitious revenue target, the productivity may not be there to hit target. Regularly assess whether sales headcount and structure align with business goals.
Use real-time productivity dashboards to simulate whether current rep output and ramp curves can support next quarter’s target. Tools like Lative make this a 5-minute task instead of a 5-tab spreadsheet maze - Improve ramp time
The faster reps become productive, the greater the overall revenue potential. Reducing ramp time by even a few weeks can have a significant impact on productivity at scale. - Use data to identify underperforming areas
Not all segments or territories contribute equally. Analyzing productivity at a business dimensional level helps prioritize efforts in high-performing areas and diagnose issues in underperforming ones.
Is your APAC team underperforming? Before you blame your reps, check the segment mix or ramp timing. Dimensional productivity helps isolate the real bottleneck. - Prioritize coaching over more activity
More calls and emails don’t always equal better results. High-productivity teams invest in targeted coaching, better enablement tools, and data-driven selling techniques.
The business impact of optimized sales productivity
Sales productivity is always more than just a sales metric. It’s a lever for operational excellence across the entire revenue engine. When teams measure and optimize productivity in real time, the effects ripple across hiring, forecasting, customer experience, and bottom-line performance.
1. Revenue growth becomes more predictable
When you track revenue per fully ramped rep, you move from gut-feel to grounded forecasting. You know exactly how much capacity exists in each segment, and you can model what happens if productivity improves (or declines) by 10-15%.
2. Headcount decisions become strategic (rather than reactive)
Instead of asking “how many reps do we need?” leadership can ask “how much revenue can our current reps generate?” Real-time productivity visibility helps you avoid bloated teams and costly overhiring, while ensuring you don’t fall short on capacity.
3. Customer experience improves because reps can actually sell
According to Salesforce’s State of Sales report, reps spend just 28% of their time actually selling. By improving productivity through better time allocation, enablement, and territory planning, reps can have more meaningful conversations beyond just more meetings.
4. Ramp time accelerates and stays visible
High-productivity orgs continuously track ramp by cohort, region, and role. That means enablement isn’t just a set-it-and-forget-it checklist—it’s a revenue driver. When a new class of reps ramps 10% faster, that adds measurable capacity to the model.
5. Cross-functional alignment becomes easier
Productivity metrics serve as a shared source of truth across RevOps, Sales, and Finance. Planning shifts from spreadsheet wrangling to scenario testing: What if we delay hiring by 30 days? What if productivity drops 12% in Enterprise? The answers are a click away.6. Profitability increases without sacrificing growth
Instead of throwing headcount at the number, you scale intelligently. Better productivity means higher revenue per rep and better ROI on sales programs, enablement spend, and GTM investments.In short: optimized sales productivity makes the entire revenue machine more capital efficient. Every rep, region, campaign, and decision is measured by output—not just activity. And the teams that win in 2025 won’t be the ones working harder. They’ll be the ones optimizing smarter.
Conclusion
Measuring sales productivity is one of the most misunderstood but critical sales performance metrics. While traditional measurements like quota attainment tell part of the story, true productivity lies in how efficiently revenue is generated across available sales capacity.
For RevOps teams, understanding and optimizing sales productivity is the key to scalable, profitable efficient growth. By moving beyond simple activity metrics and focusing rather on productivity, ramp times, efficiency and resource alignment, organizations can turn sales productivity into a true competitive advantage.
It’s not about working harder—it’s about working smarter. And when sales teams, RevOps, and leadership align around sales productivity metrics, growth becomes a matter of strategy, not just effort.
What's next?
If you’re looking to improve sales productivity at scale, it starts with the right insights. Lative helps organizations calculate and analysis your Sales Productivity and Efficiency and build sales capacity plans with real-time revenue performance—so you can track, measure, and optimize your sales productivity with clarity and confidence.